


Change in Storefront Rents, 2019 - 2021
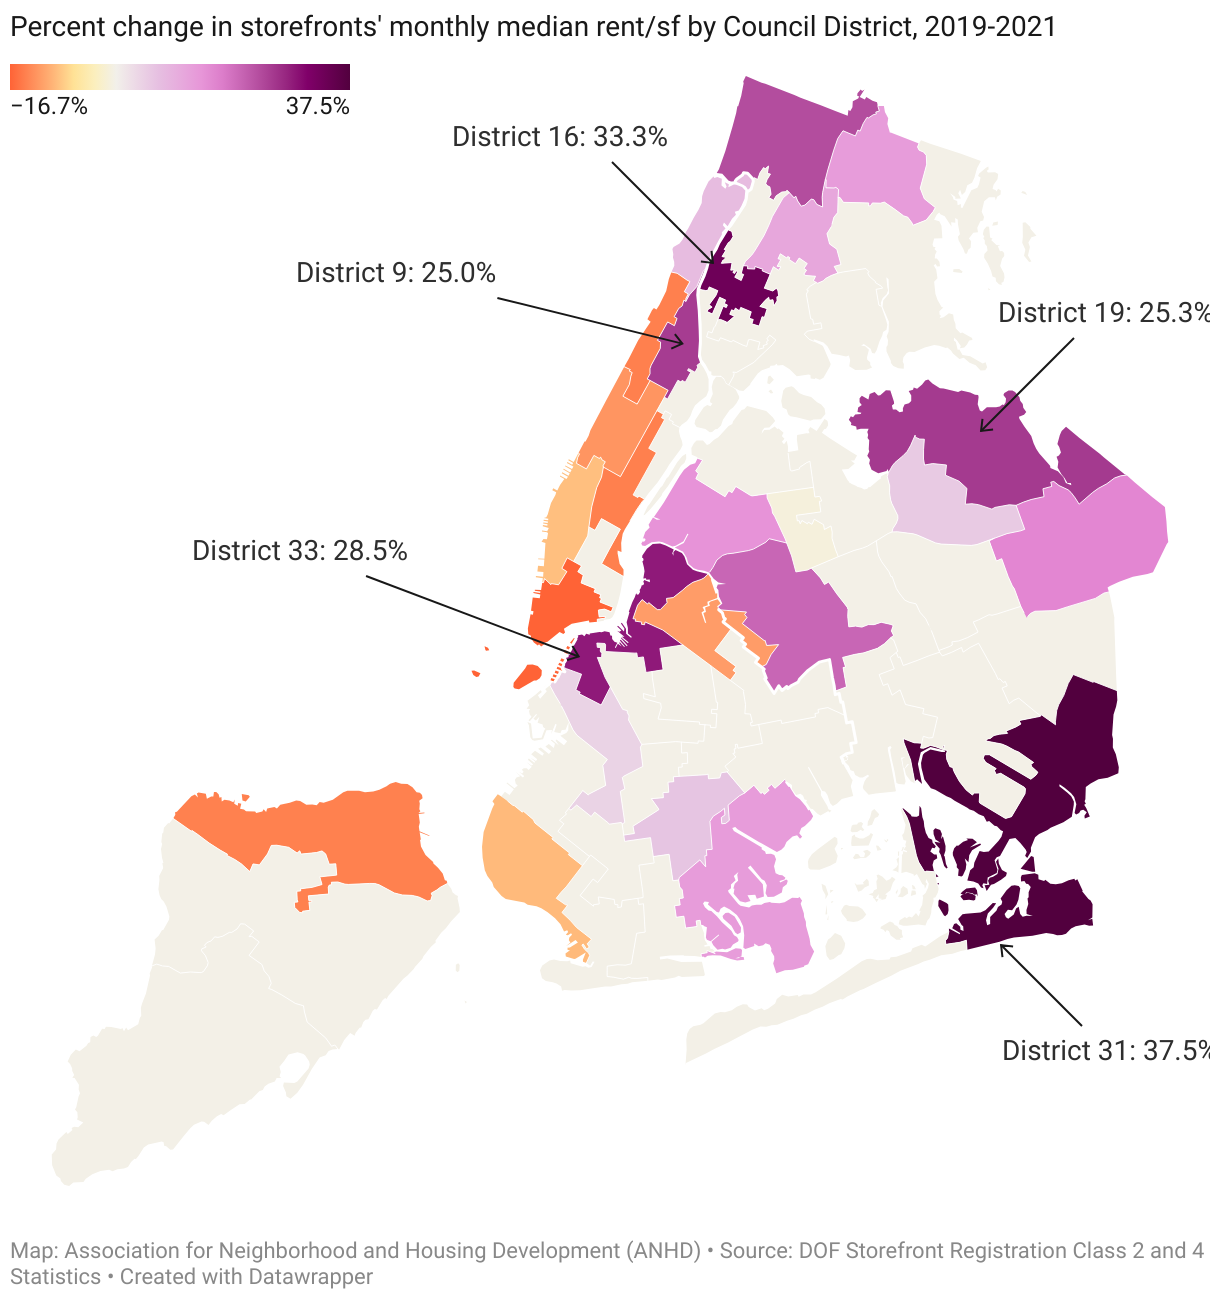
ANHD's 2023 map of changes in storefront rents from 2019-2021 shows that rents increased dramatically in parts of Upper Manhattan, the Bronx, Queens, and Brooklyn, while they decreased in most of Manhattan and parts of Brooklyn and Staten Island.
ANHD's 2023 map of changes in storefront rents from 2019-2021 follows our 2022 report, the State of Storefronts. The data we analyzed was made available through organizing by the USBnyc coalition to pass Local Law 157 in 2019, which enabled the tracking of rents, vacancies, and other data for ground and second floor commercial spaces for the first time. The map shows that from 2019-2021, storefront rents increased dramatically in parts of Upper Manhattan, the Bronx, Queens, and Brooklyn, while they decreased in most of Manhattan and parts of Brooklyn and Staten Island.
Through our analysis, we also found:
-
In the Bronx and Queens, there were no districts where rents decreased 2019-2021.
-
In districts where rents increased 2019-2021, 72.1% of the population is POC, compared to 47.2% of the population in districts where rents decreased during that period.
Borough-wide changes in rent, 2019-2021
|
Borough |
Median Montly Rent/sf, 2019 |
Median Monthly Rent/sf, 2021 |
Change in Rent, 2019-2021 |
|
Manhattan |
$9.00 |
$8.00 |
-11.1% |
|
Bronx |
$3.00 |
$3.42 |
14.0% |
|
Brooklyn |
$3.19 |
$3.92 |
22.9% |
|
Queens |
$3.67 |
$4.00 |
9.0% |
|
Staten Island |
$3.00 |
$3.00 |
0.0% |
Share this page:

