Introduction
New York City’s economy is booming. In October 2018, unemployment hit an all-time low of 4%1. Sectors like real estate and healthcare, which have been traditional strongholds of the New York economy, remain robust. The City’s job growth strategy, outlined in the de Blasio administration’s New York Works plan2, has invested in burgeoning sectors like tech and the life sciences with great success; tech jobs in New York grew by 57% between 2010 and 20163. However, the plan’s efficacy hinges on attracting new residents to the City to fill these jobs. Many New Yorkers, especially low wealth New Yorkers of color, remain disconnected from the good jobs the City has created.
Citywide – Low Unemployment, High Income Inequality
Although New York is the wealthiest city in the country, that wealth is unevenly distributed. As the City has grown increasingly unaffordable, wages have not kept up with the cost of living for average New Yorkers.
| Borough | Percentage of Total NYC Jobs |
|---|---|
| Brooklyn | 17% |
| Bronx | 8% |
| Manhattan | 58% |
| Queens | 15% |
| Staten Island | 2% |
The Bronx – Local Residents Are Not Reaping the Benefits of Living Wage Jobs
Nowhere is the divide between good paying jobs and local residents starker than in the Bronx. Though only 8% of all of New York City jobs are located in the Bronx, the borough is home to the highest concentration of living wage jobs outside of Manhattan, with 48% of all Bronx jobs paying more than $40,000 a year. The healthcare sector comprises 27% of all jobs in the borough followed by the retail, social assistance, and hospitality sectors. The Bronx remains a stronghold for manufacturing, especially food manufacturing in Hunts Point, home to the Hunts Point Produce Market, one of the largest food distribution centers in the world. The food manufacturing sector pays, on average, $65,100 a year.
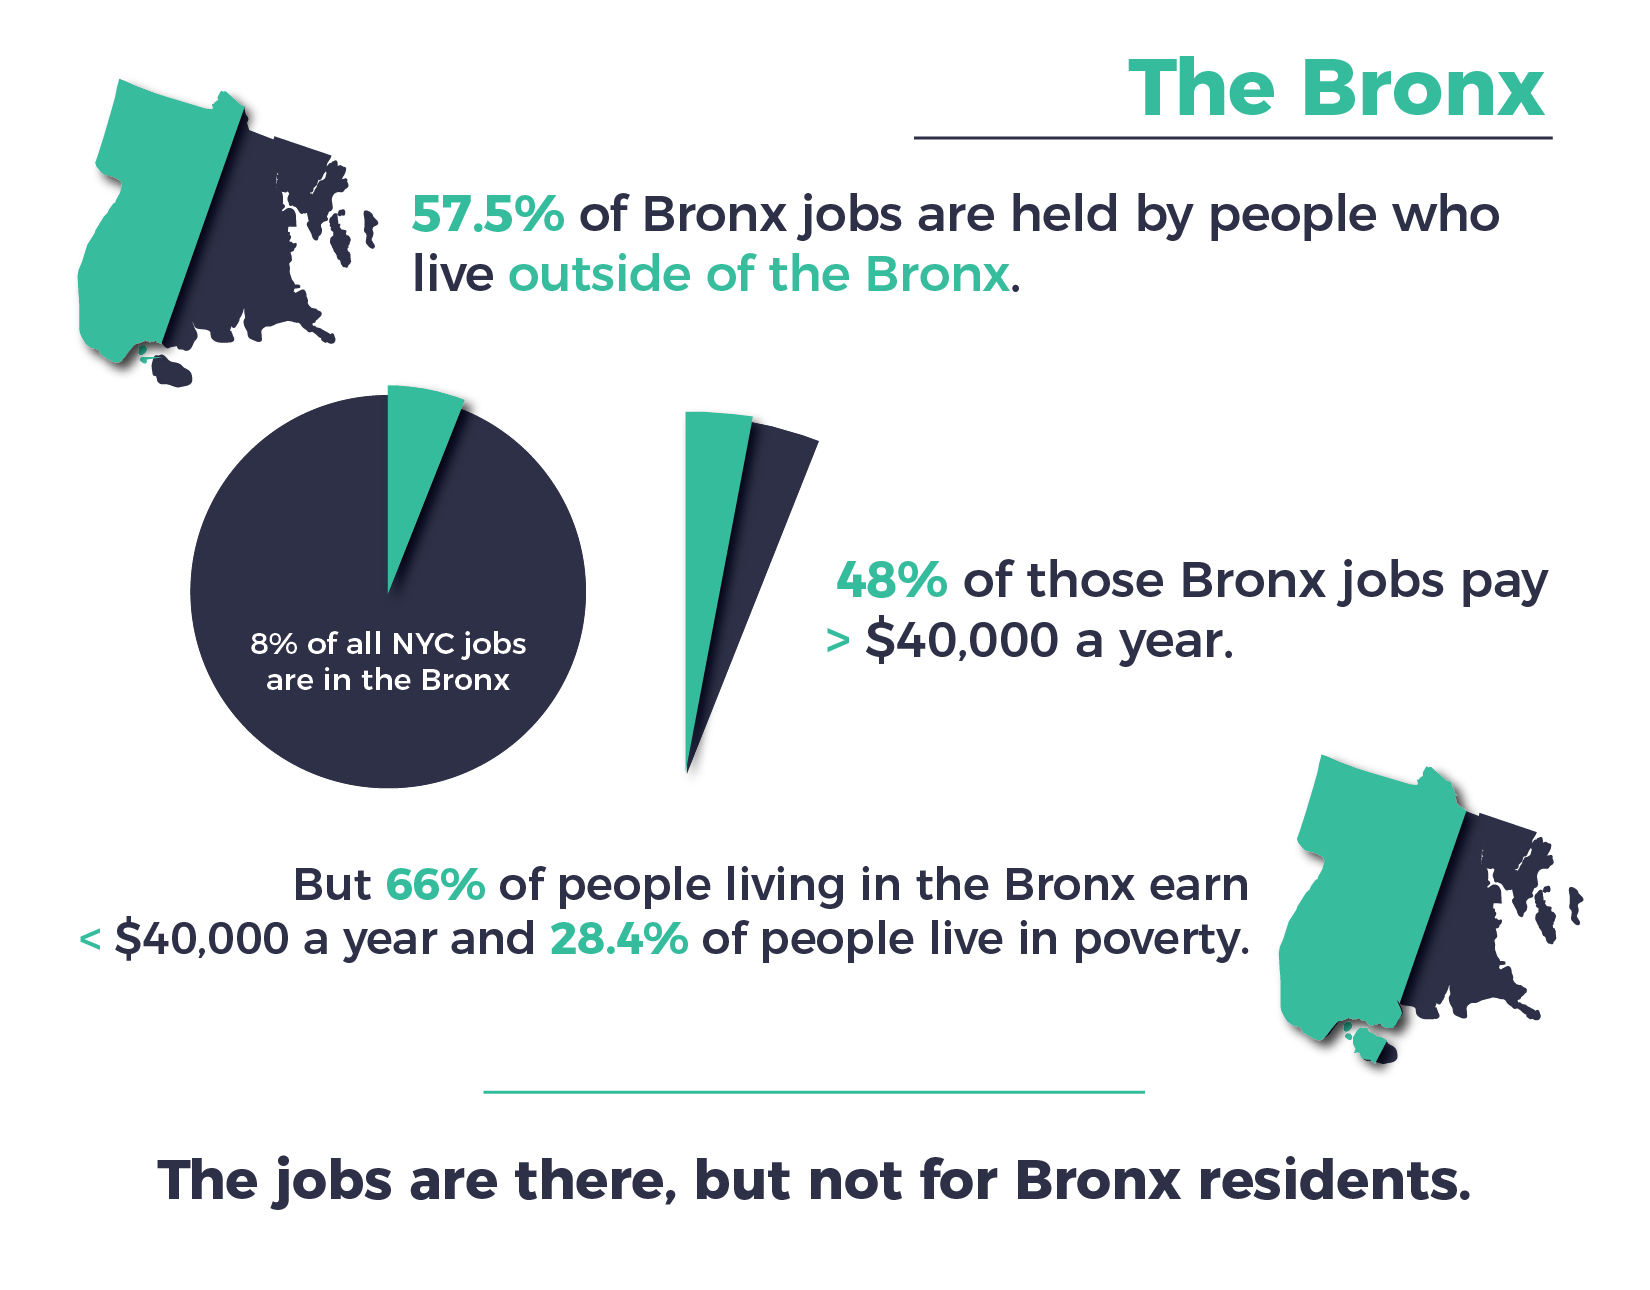 While the Bronx gained 40,900 new positions between 2007 and 2017, growing from 199,000 to 239,900 jobs13, 57.5% of all jobs in the borough are held by people who live outside of the borough. Despite the availability of good paying local jobs, 66% of people living in the Bronx earn less than $40,000 per year. This means that the majority of good paying jobs available in the Bronx are not held by Bronx residents. While the Bronx remains among the poorest counties in the country, with a poverty rate of 28.4%, some neighborhoods have seen rapidly rising rents in the past year. Borough wide, median asking rents rose from $1,600 to $1,700 between 2016 and 2017, and the percentage of residents experiencing rent burden has risen from 31.8% in 2016 to 34.9% in 2017.
This discrepancy in neighborhood job quality and jobs held by neighborhood residents is especially stark in the South and Northwest Bronx. In Kingsbridge, 60% of jobs available in the neighborhood pay over $3,333 per month. But of all employed residents in the neighborhood, only 31% hold jobs that pay over that amount. In Hunts Point, which accounted for 25% of all new job gains in the borough, 48% of jobs in the neighborhood pay more than $3,333 a month, but only 26% of employed residents hold jobs that pay over that amount. In both neighborhoods, unemployment remains higher than the citywide average of 4.8%, at 10.7% in Kingsbridge and 11.6% in Hunts Point. Thirty-one percent of Kingsbridge residents and 37% of Hunts Point residents live in poverty. Meanwhile, these neighborhoods have experienced steep rises in rent. In Kingsbridge, median asking rent increased by 23% between 2010 and 2017, from $1,050 to $1,500, while rent in Hunts Point rose from $1,600 to $1,750 between 2016 and 2017.
The divide between access to local jobs and local employment grows even larger when race is taken into account. Residents of color, in particular Black and Latinx residents, do not have access to the good paying jobs in their neighborhoods. In Kingsbridge, 67% of all working age residents, or those between the ages of 18 and 84, are Latinx. However, only 28% of jobs located in Kingsbridge are held by Latinx workers. In Hunts Point, 68% of working age residents are Latinx,while only 38% of local jobs are held by Latinx residents.
Brooklyn – New Industries, Low Wages
Brooklyn is home to the highest number of jobs outside of Manhattan, with 17% of all New York City jobs located within the borough. However, the borough also has the highest concentration of low-paying jobs in the City – 59% of all jobs in Brooklyn pay less than $3,333 a month. This may be the case because the borough has seen a rise in service sector and retail jobs, which pay less than other sectors on average. Along with service sector growth, the borough has seen a rise in new office and tech hubs – Downtown Brooklyn is the second largest business district in New York City, and the Brooklyn Tech Triangle has attracted a burgeoning tech sector.
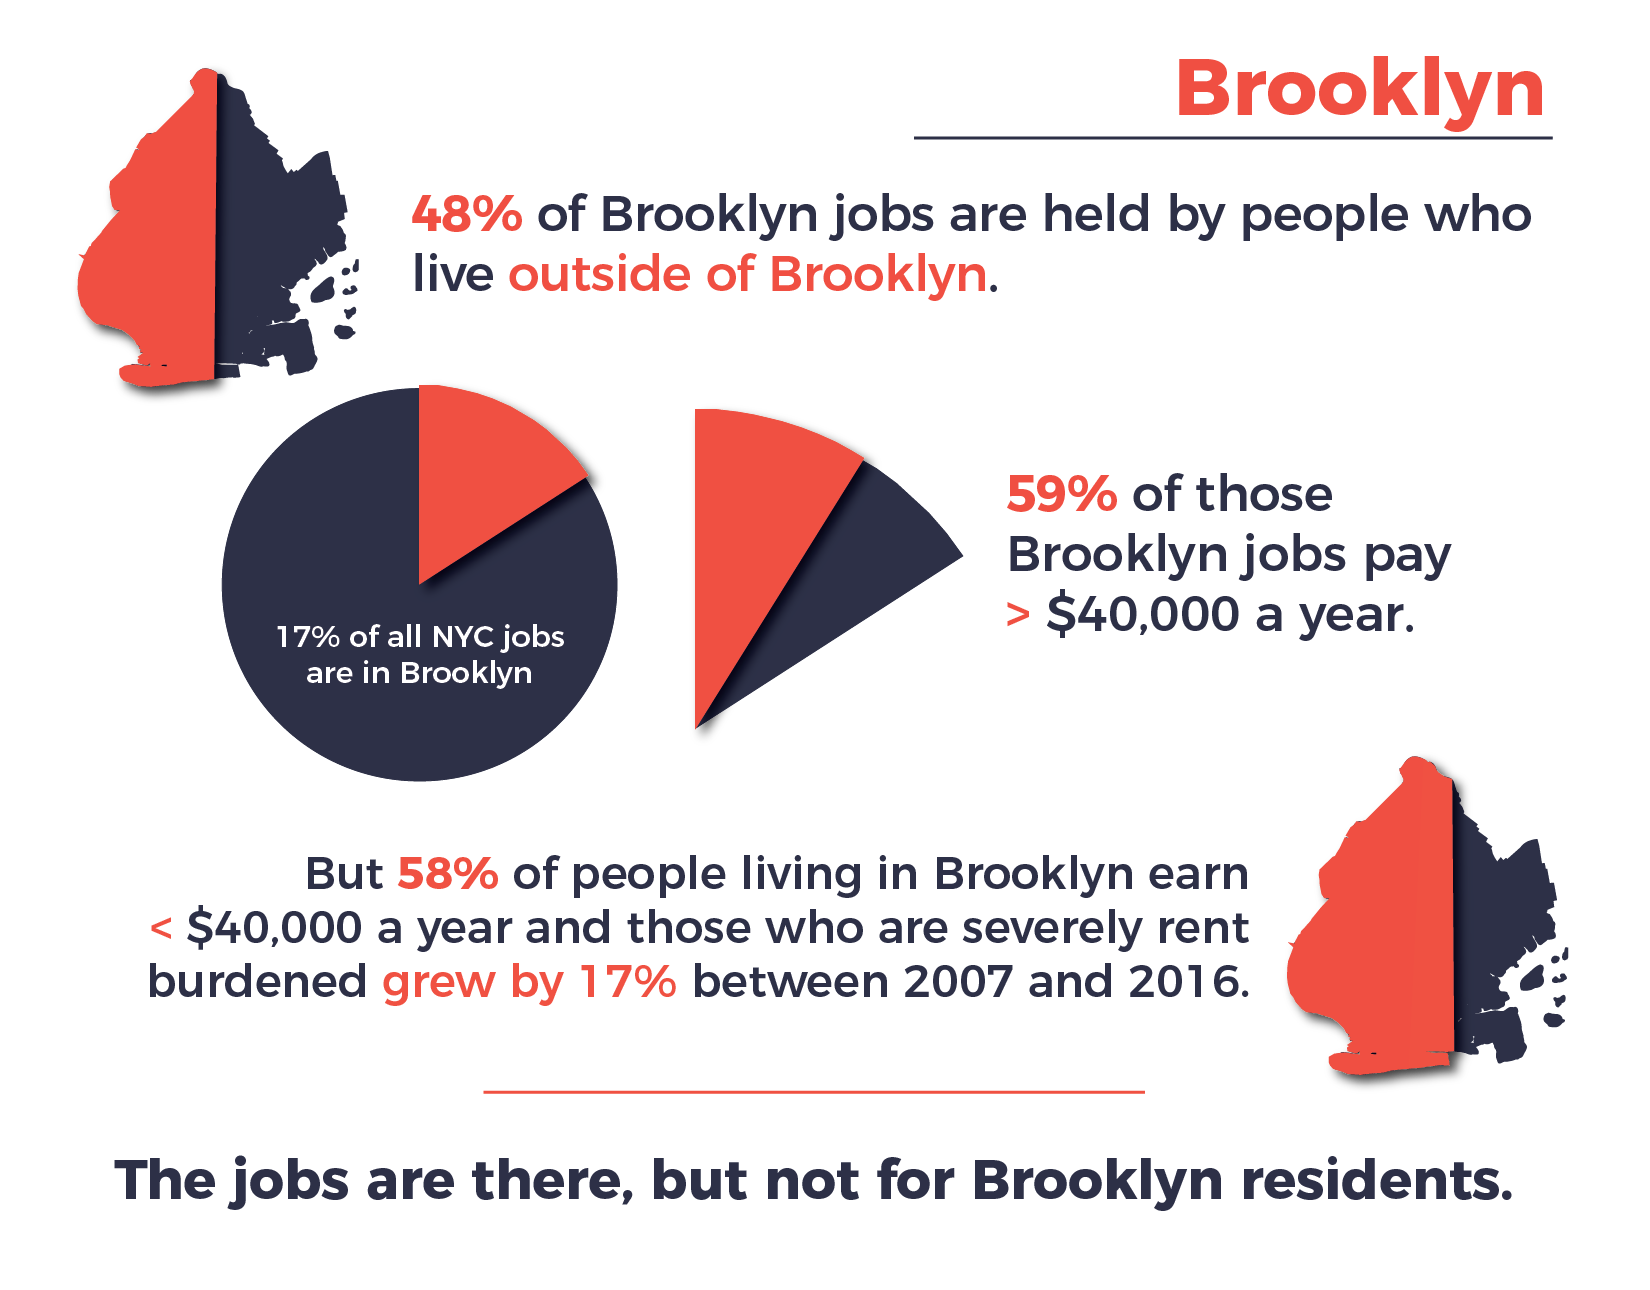 While Brooklyn has attracted citywide investment in a sectoral strategy focused on high paying tech and biotech industries, good-paying jobs still remain out of reach for most residents of the borough. Fifty-eight percent of Brooklynites hold jobs that pay less than $3,333 per month. As Brooklyn’s economy continues to grow, wages have not kept up with the cost of housing. Households that are severely rent burdened, or spend more than 50% of their household income on rent, grew by 17% between 2007 and 2016. Median asking rent rose from $2,100 in 2010 to $2,500 in 2017 borough-wide.
In historically Black neighborhoods in particular, the presence of good paying jobs in their neighborhoods has not led to economic mobility. In Crown Heights, 53% of neighborhood jobs pay more than $3,333 per month, while 61% of residents hold jobs that pay less than that amount. And Black residents are less likely to be employed locally. Additionally, 29% of residents are severely rent burdened, meaning that more than 50% of their monthly income is spent on rent. Median asking rent in the neighborhood rose at a startling 35% from $1,850 to $2,500 between 2010 and 2017.
In East Flatbush, 53% of neighborhood jobs pay $3,333 or more a month, while 64% of jobs held by residents pay less than that. Only 42% of local jobs are held by Black workers even though 91% of neighborhood residents are Black. And median asking rent rose from $1,650 in 2010 to $1,900 in 201714.
One of the biggest discrepancies between local jobs and local wages in New York City is in Brownsville, where Black and Latinx residents comprise 74% and 21% of all residents respectively. While 47% of jobs in Brownsville pay more than $3,333 a month, 70% of residents hold jobs that pay less than that. Though the majority of neighborhood residents hold low paying jobs, rents across the neighborhood have risen dramatically. Between 2016 and 2017 alone, Brownsville experienced a 30% increase in median asking rents, from $1,650 to $2,150. Rising rents coupled with little access to good paying jobs leaves residents especially at risk of displacement. Thirty-six percent of residents are severely rent burdened, and the neighborhood has one of the highest rates of unemployment in New York City, at 13.8%.Despite historically low unemployment citywide and despite Brooklyn’s growing economy, Brownsville residents continue to be left behind.
| Borough | Percentage of Black Workers | Percentage of Asian Workers | Percentage of Latinx Workers |
|---|---|---|---|
| Brooklyn | 28% | 10% | 18% |
| Bronx | 31% | 7% | 32% |
| Manhattan | 18% | 12% | 17% |
| Queens | 24% | 14% | 22% |
| Staten Island | 17% | 7% | 15% |
| Citywide | 21% | 12% | 19% |
Manhattan – Neighborhoods of Color Face Growing Displacement Pressures
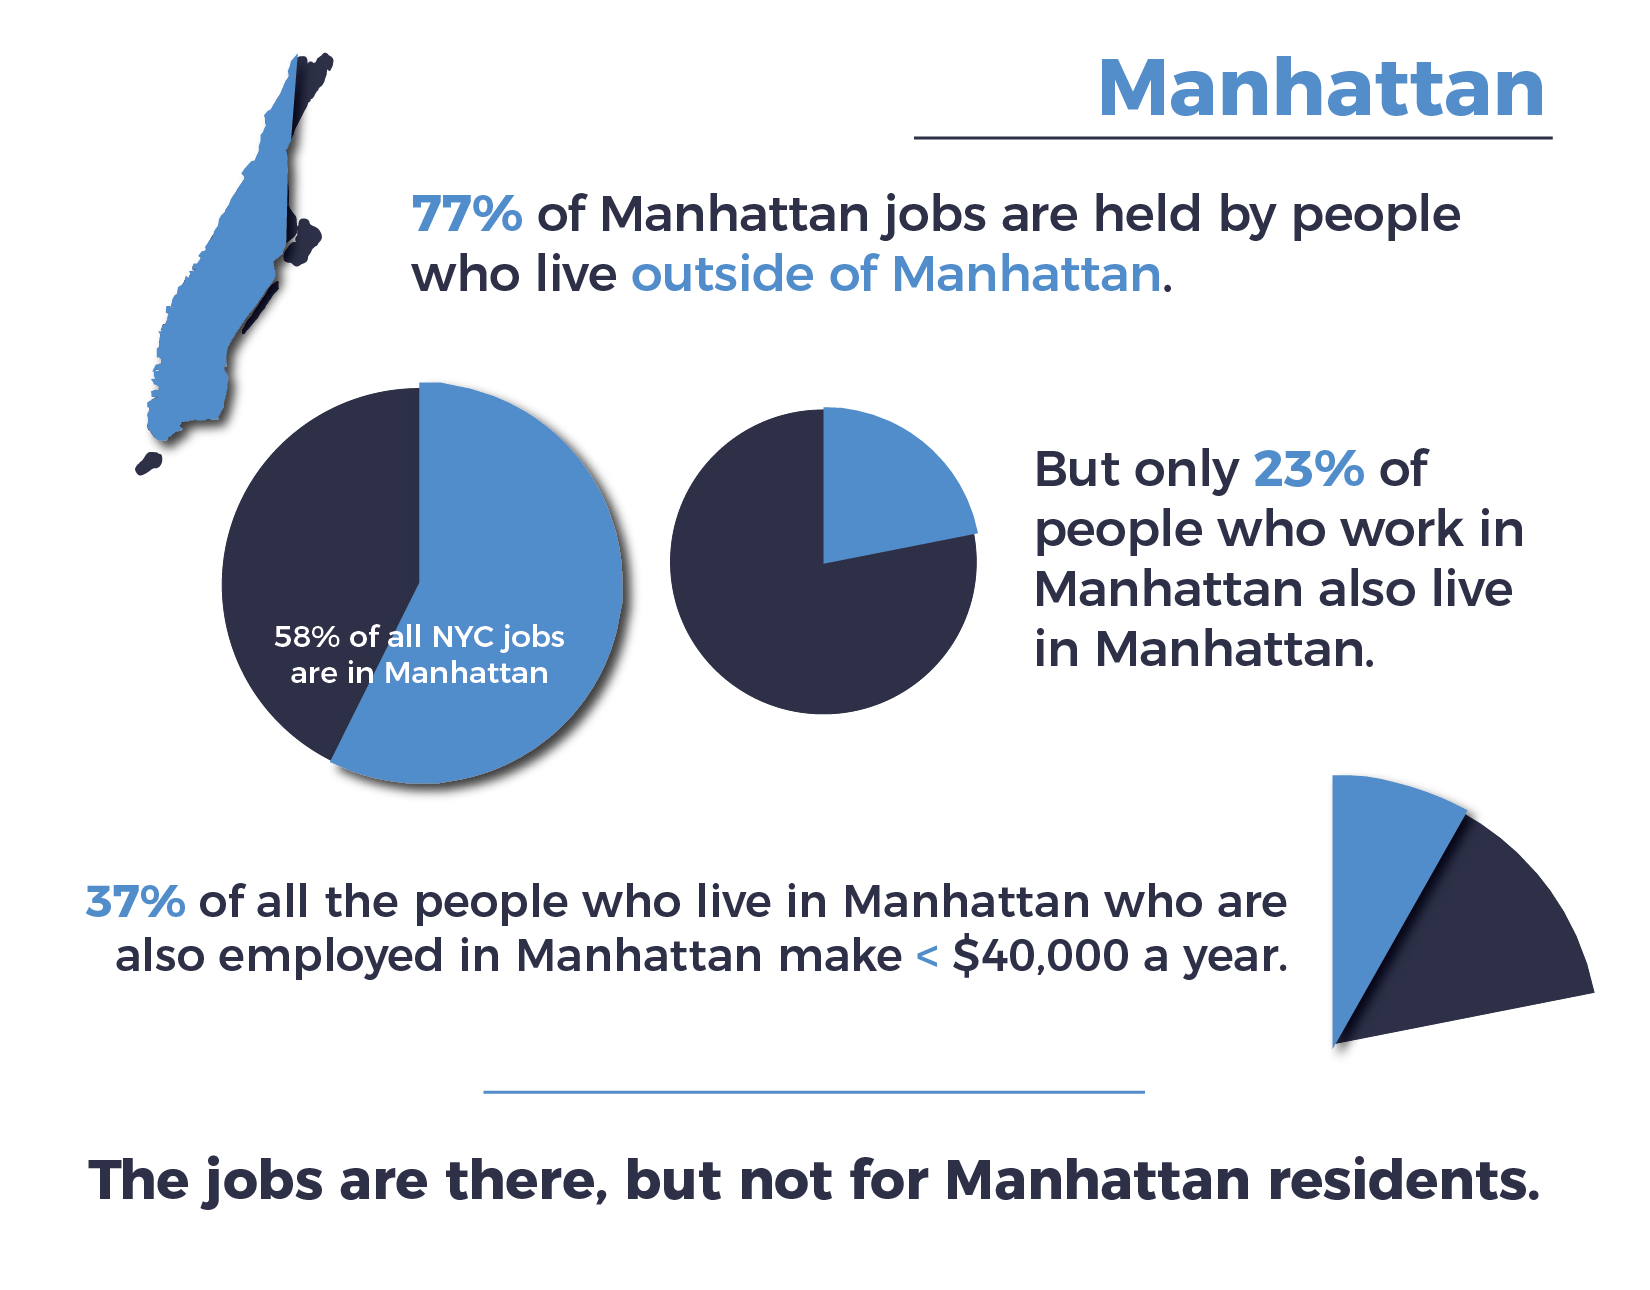
Fifty-eight percent of New York City jobs are concentrated in Manhattan. As the City’s economic center, the majority of workers in Manhattan commute into the borough from elsewhere. Only 23% of people who work in Manhattan also live in Manhattan. Income inequality is a major issue for the borough. Despite its concentration of high paying jobs, 37% of all employed Manhattan residents are employed in positions that pay less than $3,333 a month.
 The greatest discrepancy in local jobs and local wages occurs in the neighborhoods that remain majority nonwhite and face growing displacement pressures due to rising rents. In Washington Heights/Inwood, 51% of local jobs pay more than $3,333 per month, but 61% of residents hold jobs where they earn less than that. Sixty-eight percent of working age residents of the neighborhood are Latinx, but only 33% of the local workforce is Latinx – while Latinx residents make up the majority of the neighborhood population, they only comprise a third of its workforce. Residents of Washington Heights and Inwood are at particular risk of displacement as rents outpace income – 32.3% of households are rent burdened, and median asking rent rose from $1,600 in 2010 to $2,090 in 2017. And, as reported by the Furman Center, the number of rental units affordable at 80% of the Area Median Income (AMI) decreased from 61% of the housing stock in 2010 to only 42% in 2017. As the neighborhood faces a rezoning that further heats the local housing market, this gap will likely continue to grow.
A similar racial jobs gap exists in the Lower East Side/Chinatown. While 32% of residents are Asian, only 23% of jobs in the neighborhood are held by Asian workers and while 23% of the neighborhood is comprised of Latinx residents, only 18% of jobs are held by Latinx workers. Both groups face levels of unemployment that are higher than the Citywide average – 7% of Asian and 15.4% of Latinx residents in the Lower East Side/Chinatown are unemployed, as compared to 6% of New York City’s total Asian population and 10% of the City’s total Latinx population. Nearly a quarter of neighborhood households are rent burdened – median asking rent in the neighborhood grew from $2,500 in 2010 to $3,000 in 2017.
Queens – Stability at Risk
Job growth in Queens has grown at a rapid clip since 2009, with private sector jobs growing by 24% since 2009. Queens has seen several large scale economic development projects in the past ten years. This includes a $10 million economic development investment by New York State into Jamaica’s neighborhood economy, office growth in Long Island City, and the rise of a growing hotel industry in Flushing. Jobs have grown rapidly in the health care, hospitality, and business services fields. Growth in the City’s transportation sector has been concentrated in Queens – transportation is the second largest sector after healthcare with an average salary of $63,400 annually16.
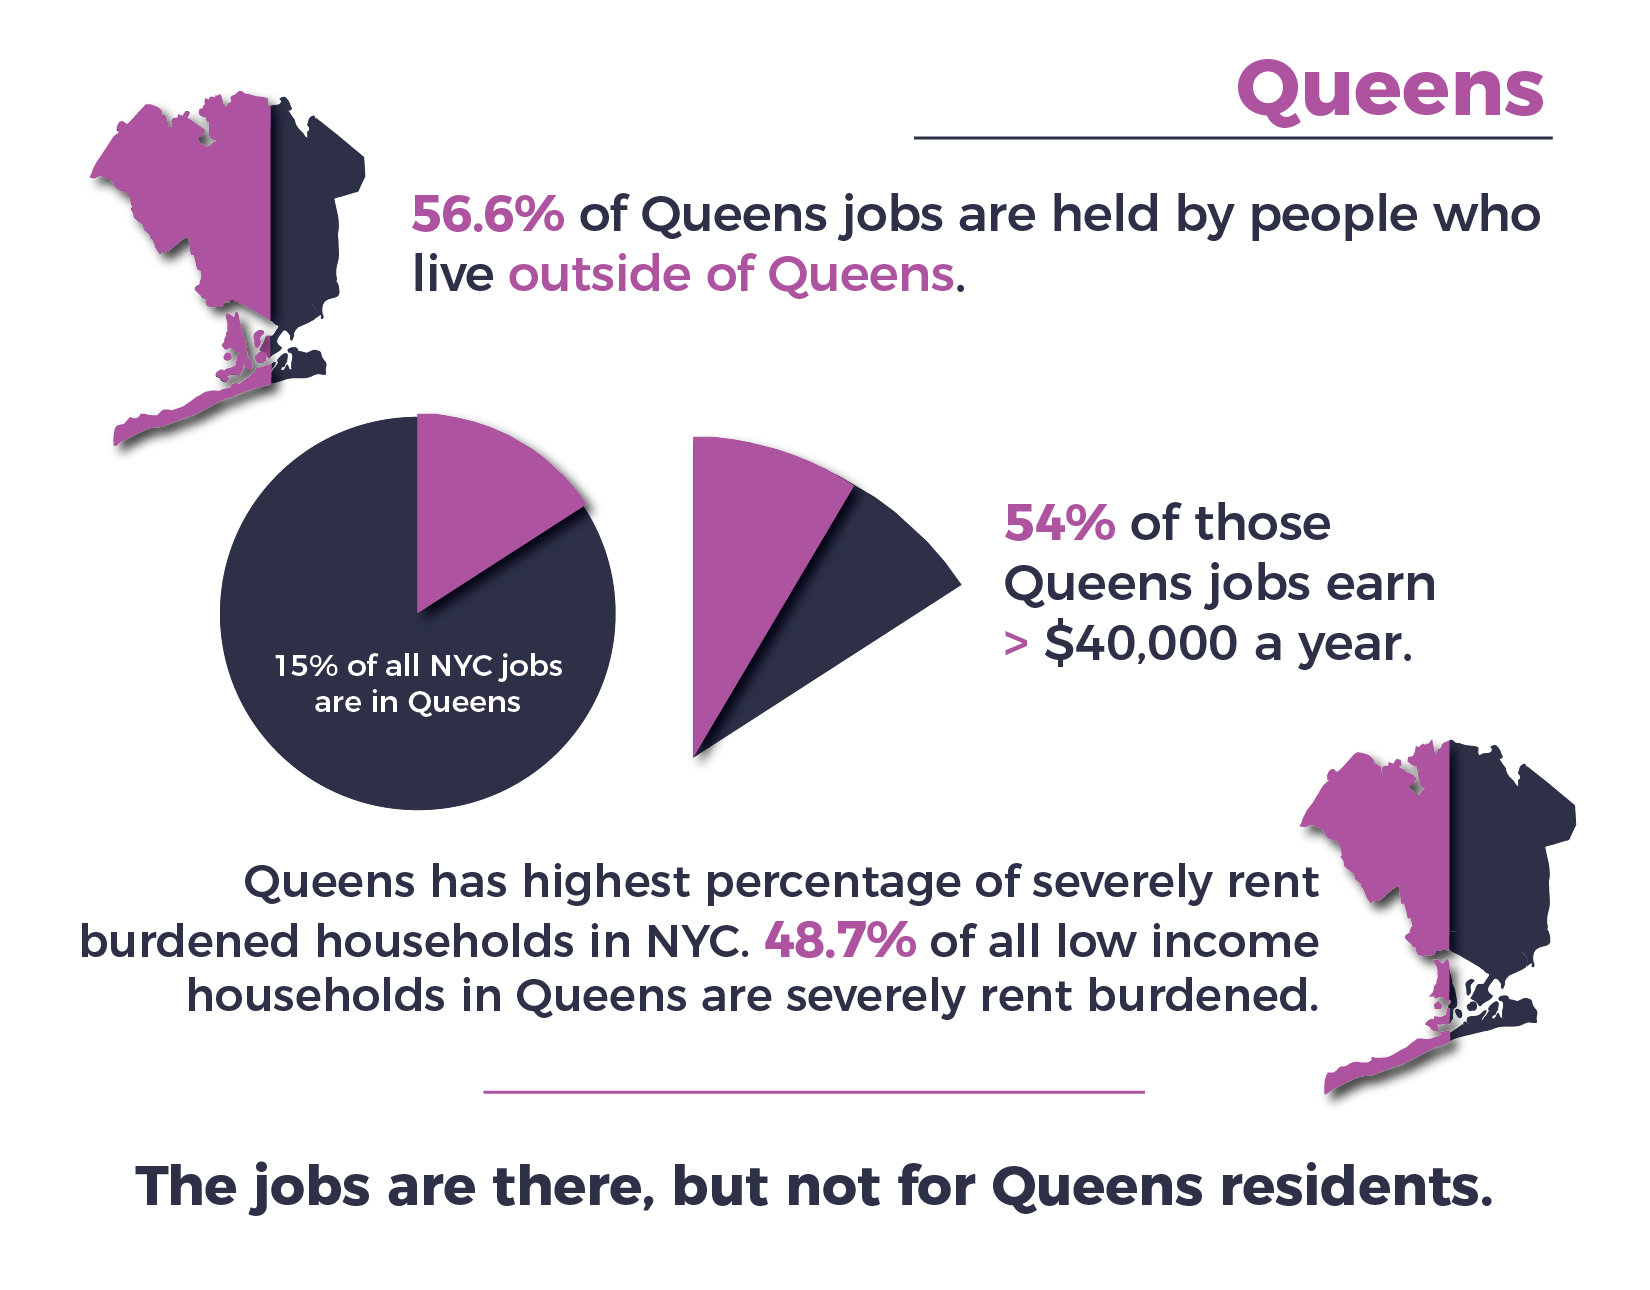 The borough had the highest average salary outside of Manhattan at $48,400 in 2016. But despite its strong supply of good paying jobs, 54% of jobs in Queens pay less than $40,000 a year. The borough also has the highest percentage of severely rent burdened low-income households in the City, with 48.7% of all low income households in Queens spending 50% or more of their income on housing.
In Elmhurst, where 37% of residents are severely rent burdened, 40% of neighborhood jobs pay more than $3,333 per month, but 65% of residents earn less than that. Median asking rent in the neighborhood has risen from $1,150 in 2010 to $1,850 in 2017, a 60% increase. While 15% of all jobs in Elmhurst are held by Asian workers, 35% of residents are Asian. Similarly, while Latinx residents comprise 48% of the neighborhood population, only 26% of all workers employed in the neighborhood are Latinx.
In Jamaica, home to John F. Kennedy Airport, one of the City’s largest employers, and recipient of a $10 million economic development investment from New York State, 39% of jobs in the neighborhood pay more than $3,333 per month. However, 63% of Jamaica residents are employed at jobs that pay less than $3,333 per month. Thirty-two percent of households are severely rent burdened. While 65% of Jamaica residents are Black, only 35% of the neighborhood workforce is comprised of Black employees. And, unemployment disproportionately impacts Black residents. Though citywide unemployment may be at a record low, 12.8% Black residents in Jamaica are unemployed17.
| Borough | Percentage of Jobs That Pay > $40,000/YR | Percentage of Jobs That Pay ≤ $40,000/YR |
|---|---|---|
| Brooklyn | 59% | 40.6% |
| Bronx | 53% | 47.3% |
| Manhattan | 42% | 58.1% |
| Queens | 56% | 43.6% |
| Staten Island | 58% | 42.3% |
Staten Island – Black and Latinx Workers Are Not Benefiting from New Job Growth
Staten Island, like the rest of New York City, has experienced record low unemployment at a rate of 3.9% as of October 201818. While Staten Island is home to the fewest jobs of any borough, it added 11,000 jobs between 2012 and 2017, mainly in the construction, social assistance, hospitality, and health care sectors. Large new projects such as Harbor Commons in St. George and the rise of luxury developments such as Urby in Stapleton are slated to create new jobs in retail and construction. However, there is no guarantee that these will be good jobs.
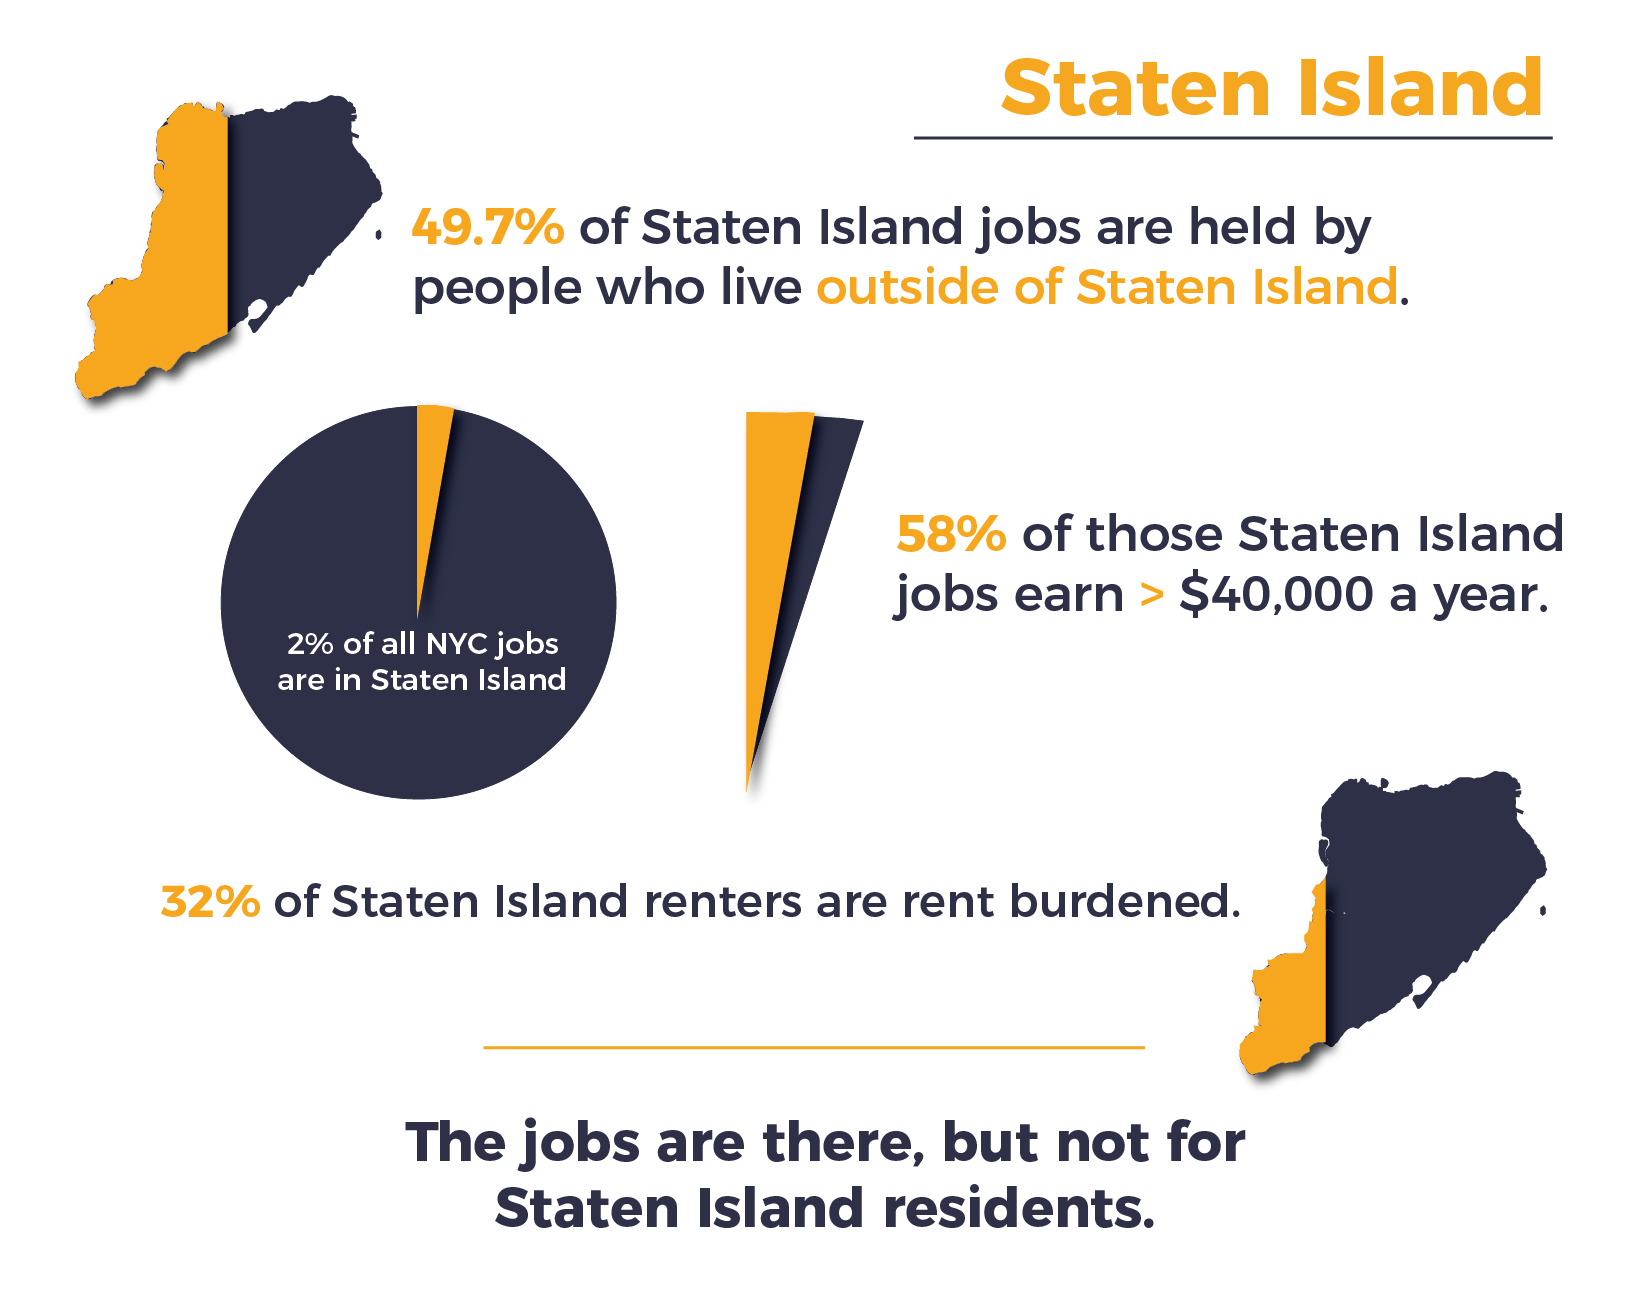 While most of Staten Island’s labor force both lives and works in the borough, there remains a discrepancy in who benefits from the borough’s good paying jobs. Staten Island is home to the second highest concentration of low paying jobs after Brooklyn, with 58% of total jobs in the borough paying less than $3,333 a month. Thirty-two percent of Staten Island renters are rent burdened. Like elsewhere in the City, communities of color face the largest gaps in local employment. In Stapleton and St. George, the two areas most impacted by new construction and new economic development initiatives, Black workers represent only 18% of all employees, though 23% of working age adults in the neighborhood are Black. Latinx workers represent 27% of all working age people in Stapleton and St. George, but comprise only 15% of workers employed in the neighborhood.
Conclusion & Recommendations
While New York City prospers, many of its low wealth communities have not reaped the benefits of that prosperity. The wealth generated by the City’s economic boom has been distributed unequally across the five boroughs and even more unequally for low wealth communities and communities of color. This is a result both of long-term economic trends, as well as specific economic development strategy decisions made by the City’s leadership. While New York is succeeding in its goal of growing and diversifying its tax base, this growth has not equally benefited, and may even come at the expense of, New Yorkers from middle-income and low wealth communities and communities of color. Economic development initiatives such as the New York Works plan have committed to a job growth strategy that focuses on attracting new, highly paid workers to the city rather than ensuring that current residents directly benefit from new opportunities. The residents that are overlooked by the City’s job growth strategy are the same residents who have continually been excluded from opportunities for economic mobility because of policies rooted in systemic racism. A job growth strategy that does not take into account historic discrepancies in access to economic opportunity simply continues the same legacy of systemic exclusion of communities of color. Unless these discrepancies are addressed, good jobs might exist in New York City, but they will remain out of reach for communities of color.