These Climate and Housing Displacement maps are part of a collaboration between the Association for Neighborhood and Housing Development, Environmental Defense Fund, and Regional Plan Association to visualize where climate change-induced displacement and other forms of housing displacement risk intersect in New York City.
These maps utilize RPA’s climate displacement data in combination with some common indicators of displacement used by ANHD. The maps are meant to inform stakeholder conversations to understand the intersections of climate and other forms of displacement to move towards policy solutions to these intersecting challenges.
How were the maps produced?
An R code compiled the data for these maps and the maps were styled in QGIS. All indicators were aggregated at a Neighborhood Tabulation Area (NTA) level to approximate neighborhoods.
Climate Loss Data
Climate Loss Data comes from RPA’s Climate Change Housing Deficit Analysis, which RPA provided directly to ANHD.
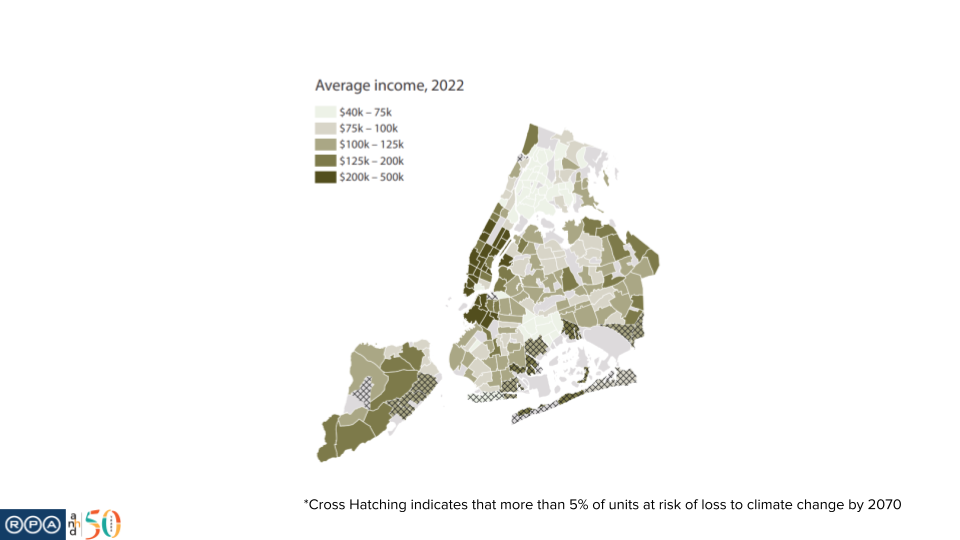
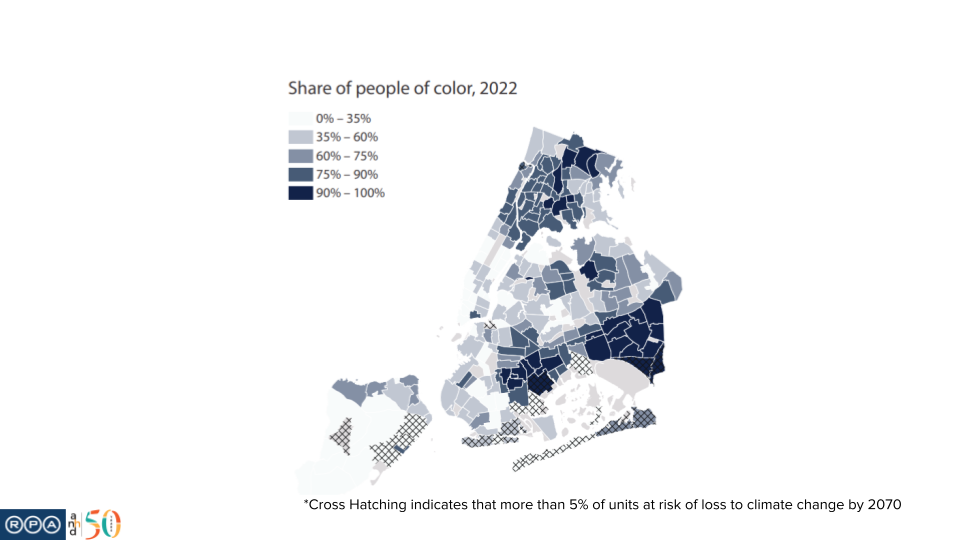
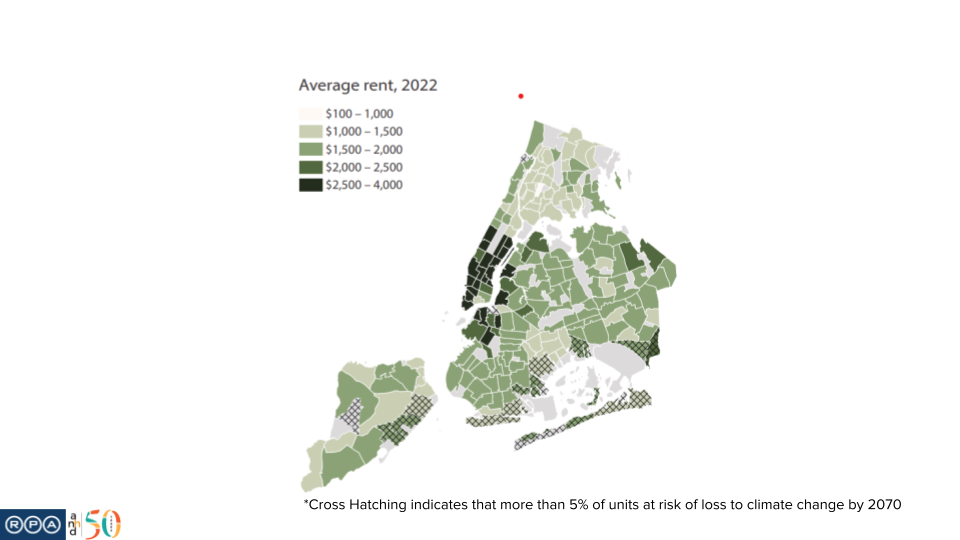
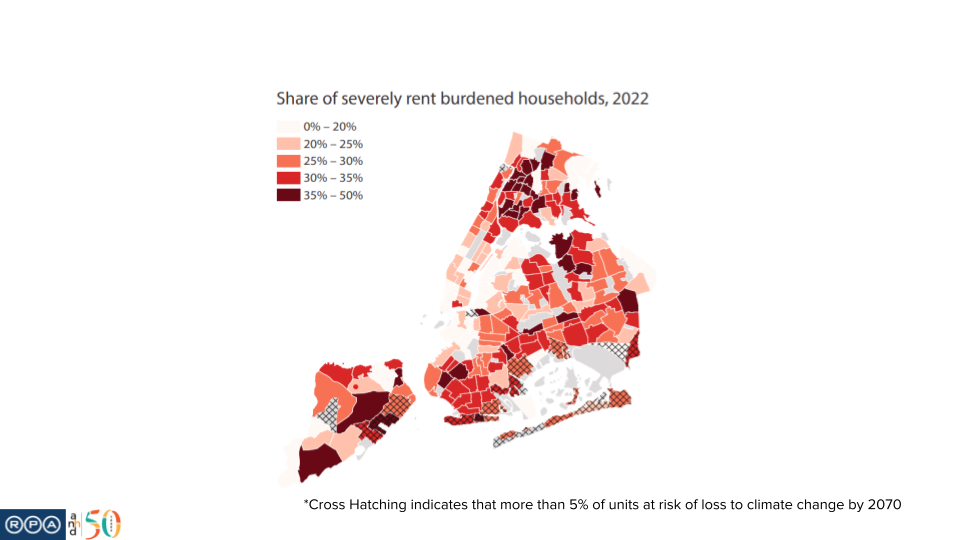
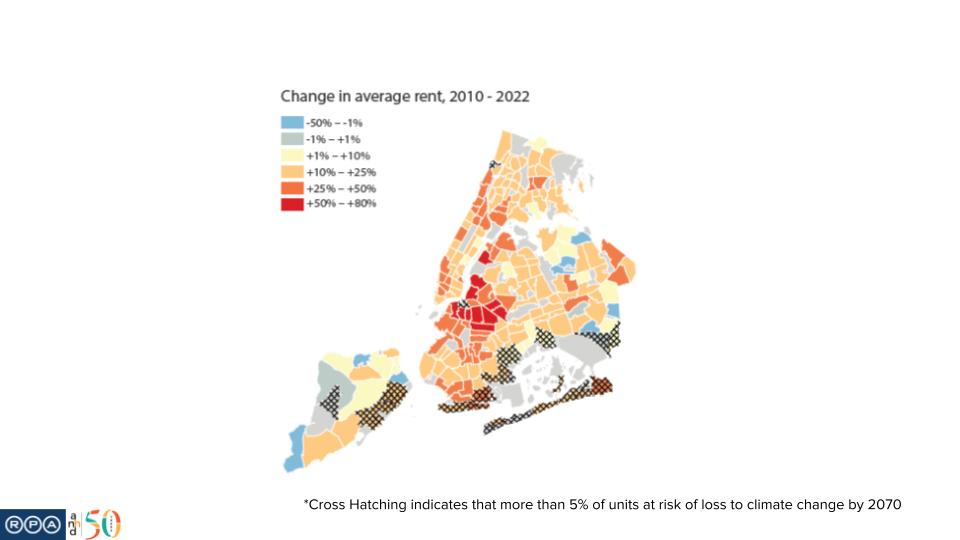
To create a climate displacement overlay for the housing displacement maps (shown with crosshatching), ANHD selected NTAs in which the total projected housing lost in 2070 will be at least 5%.
Housing and Demographic Displacement Data
All of the following variables come from Census American Community Survey, 5-year estimates at the census tract level and were aggregated by NTA. Except for ACS 2010 5-year estimates used to calculate change in average rent, all data used was from 2022 (most recent year available at the time of map creation). Whereas we would typically use median values for rents and incomes, because we needed to aggregate census tracts to the NTA level, we used averages instead.
Census ACS 5-Year estimate tables used:
- Average rent: 25065 and 25003
- Change in average rent, 2010-2022: 25065 and 25003
- Share of people of color: B02001
- Share of severely rent burdened Households: B25070
- Average income: B19025 and B11001
Note: some NTAs contain very few housing units and show values for housing unit loss, but not for demographic data, e.g. Inwood Hill Park (MN1292) and Jacob Riis Park-Fort Tilden-Breezy Point Tip (QN8492). This is likely because PLUTO shows residential units but the numbers of housing units/households is too small for them to reliably appear in Census data.