Key Findings
People of color – particularly Black and Latino – and low- and moderate-income people are being locked out of homeownership in New York City.
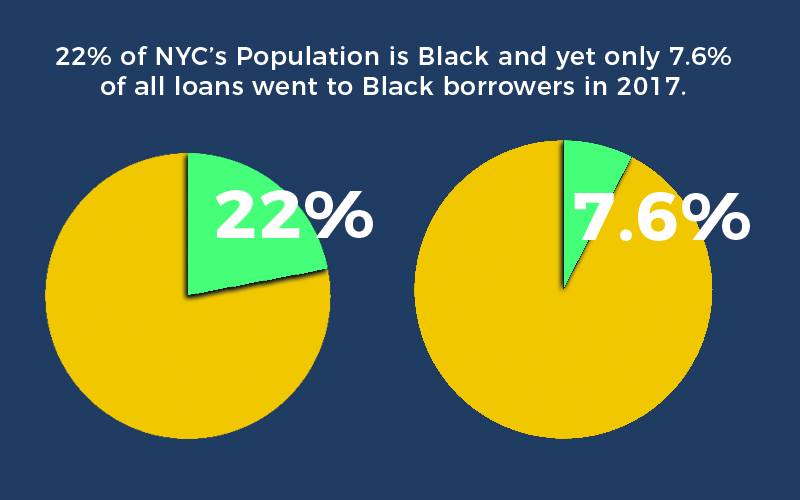
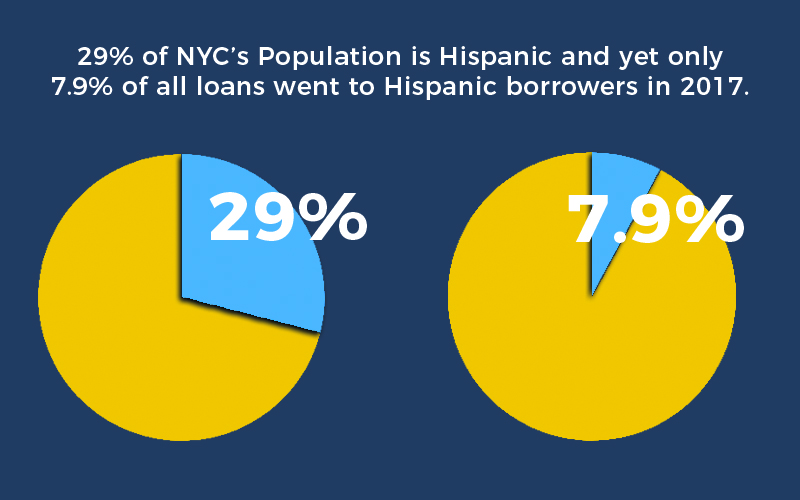
Racial disparities in lending persist, and are getting worse – 22% of New York City’s population is Black and 29% is Hispanic, yet fewer than 7.6% of all loans went to Black borrowers and 7.9% to Hispanic- a lower rate for both from the prior four years.
Non-bank lenders are increasing their presence overall, and particularly to borrowers of color and in neighborhoods of color, while banks are retreating from lending to and in those communities, placing these communities at a greater risk of paying higher costs and making them vulnerable to risky behavior (as non-bank lenders have fewer oversights than CRA-regulated banks).
The 2017 HMDA data analyzed by ANHD reveals the continuation of troubling trends noted in prior white papers. Fair lending laws and the Community Reinvestment Act (CRA), were passed over 40 years ago to address the practice of redlining and disinvestment by both government and financial institutions. HMDA was created soon after in order to enforce fair lending laws and help fight against the systematic denial of access for people of color to homeownership and banking.
HMDA is one of the most important tools the government and the public has to analyze the home mortgage market. Through HMDA, we can evaluate residential lending overall and by individual lenders to better understand who is, and isn’t, getting access to credit and identify patterns of discrimination. HMDA data is available down to the census tract, enabling the public to evaluate the market at a very local level. Under HMDA, most bank and nonbank lenders must disclose a wide range of information regarding their mortgage lending activity, including:
- Loan Data: property type (1-4 family, multifamily, manufactured housing); loan purpose (home purchase, refinance, home improvement); loan type (conventional, FHA, VA); property location (census tract, including income level and demographics); and if the loan was a “high-cost” or subprime loan
- Applicant Data: race, ethnicity, income, and gender of each applicant and co-applicant
- Outcomes: whether the loan was approved, denied, withdrawn, etc.
HMDA data is one key piece of a bank’s CRA evaluation, which measures how well the bank is meeting the credit needs of low-and moderate income (LMI) people and neighborhoods where the bank operates. Yet, despite its origins, the CRA is “color-blind,” such that banks are not evaluated on their record of serving people and communities of color. Following the 2008 financial crisis, congress passed the Dodd-Frank Wall Street Reform and Consumer Protection Act (commonly known as the “Dodd-Frank Act”), which contained numerous provisions around liquidity and capital requirements, and types of activities banks can engage in to safeguard the country from another financial collapse. The law also put in place numerous consumer protection provisions and created the Consumer Financial Protection Bureau (CFPB), which consolidates the enforcement of numerous consumer protection laws under one agency and gives that agency the power to hold financial institutions accountable to discriminatory or harmful practices, including fair lending violations.
As part of that mission, the Dodd Frank Act included a mandate to expand the data collected under HMDA to better understand the mortgage market, capture more loans, and uncover harmful practices. The final rules expanded the types of loans reportable under HMDA, including CEMA loans, which are very common for multifamily mortgage refinancing, but are used in 1-4 family as well, as a way to reduce mortgage recording taxes. 2 The rules also include additional data to better understand the types and characteristics of lending that led to the financial crisis, or may do so in the future. These include home equity loans; home equity lines of credit; reverse mortgages; manufactured housing; new data on underwriting criteria, such as debt to income ratios, credit scores, and improved disclosure of loan terms and pricing; and disaggregated race and ethnicity information that better reflects the diversity within the Hispanic, Asian, and Native Hawaiian / Pacific Islander populations. These are critical to better uncover discrimination and disparate lending patterns.
As comprehensive and powerful as HMDA is, it is incomplete and allows for many lenders to not be held accountable for their lending practices. For example, HMDA has long exempted CEMA loans, which make up a significant volume of loans in New York, and particularly multifamily loans. As mentioned above, under Dodd Frank, CEMA loans will be reported starting in 2018 along with the new data points, but what will not change is the exemption of lenders that do not make any 1-4 family home loans, regardless of the number of multifamily loans they make. And Dodd Frank went on to exempt lenders that make fewer than 25 loans for two years in a row. Even before the expanded data collection went into effect, the new data collection was rolled back considerably under the recently passed “Economic Growth, Regulatory Relief, and Consumer Protection Act,” also known as S.2155. This bill exempts lenders making 500 or fewer loans from reporting on the expanded data fields, thus shielding as much as 85% of lenders from additional public scrutiny necessary to root out disparities and fraud.
Low- and Moderate-Income People Are Locked Out of Homeownership
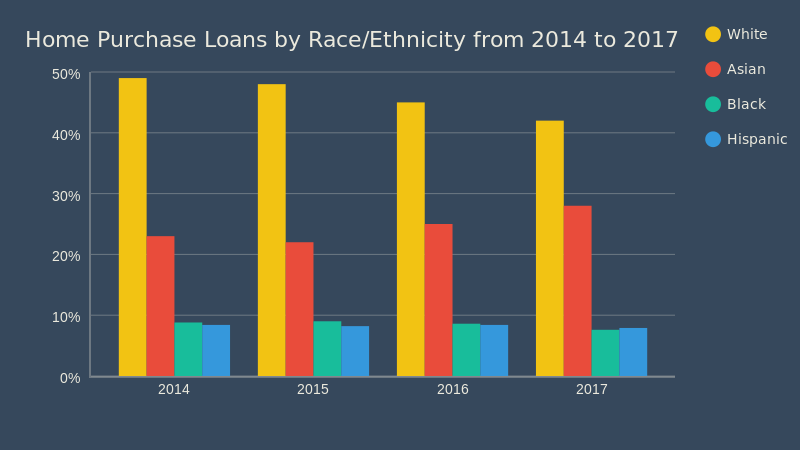
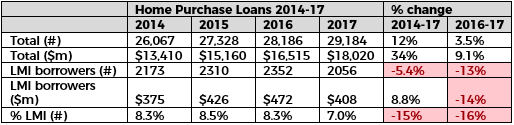 Home purchase lending has risen steadily over the past four years, up 12% from 2014 to 2017 and 3.5% from 2016 to 2017. The amount loaned increased at an even faster pace, and yet, the number and percentage of loans to LMI borrowers has been declining. This is somewhat understandable, given the high and rising cost of housing in New York City; sales prices have been increasing steadily for the past six years. In 2017, sales prices increased 11% for single-family homes and 14% for 2-4 family homes.5 Meanwhile, in 2016, 44% of homeowners that already had a mortgage were rent-burdened, paying more than 30% of their income on housing. That being said, some lower-income borrowers were getting loans by banks and non-banks, but there is more banks can do to reach these borrowers today through products, financial assistance, outreach, and partnerships.
Under the CRA, banks are evaluated on the volume of their home lending, and the percentage of “CRA loans,” which are loans to LMI borrowers and loans in LMI tracts. This has led to the creation of affordable “CRA loan” products, fostered innovative partnerships, and increased staff resources dedicated to expanding lending to meet their obligations. CRA loan products are available to people in the banks’ assessment areas that meet either criteria. Banks that take this most seriously will offer a range of CRA products, including portfolio products and governmentbacked loans with a low down payment requirement, financial assistance, flexible underwriting, and they will form partnerships with nonprofit organizations that provide homeownership counseling.
 While certainly some of the CRA loan products are going to LMI borrowers, we note that many middleand upper-income borrowers are getting loans by CRA-covered banks to purchase homes in LMI tracts. Regardless of which product they use, banks get credit for the loans, and this means that many of these CRA loans are not benefiting the people that the law was intended to support and could in fact be contributing to gentrification and displacement as banks get CRA credit for all loans in LMI tracts.
Although some middle-income borrowers can use assistance in a high-cost market like New York City, there are often no limits on the income of the borrower for CRA products in LMI tracts. This is particularly concerning in areas that are already gentrifying rapidly, such as parts of Northern and Central Brooklyn.6 But, we are also seeing this trend in areas like East New York and upper Manhattan, which are going through rezonings and beginning to experience higher displacement pressures. These are just a few examples of areas where local residents increasingly cannot afford to buy homes in their own communities.
 In East New York, for example, the median income was $38,620 in 2016 ($3,017 per month), but the median sales price per unit that year was $412,000 for a single-family home and $245,201 for 2-4 family home. To afford a home for $412,000, with a 20% down payment, a family would have to earn nearly double that income and have $82,400 to put down. But, given the high cost of living in New York City – childcare, clothing, food, as well as the cost of maintaining such a home – a family would likely need to earn well above even double that income to afford a home at this price. A person can’t afford a $412,000 home on a $38,620 per year salary.
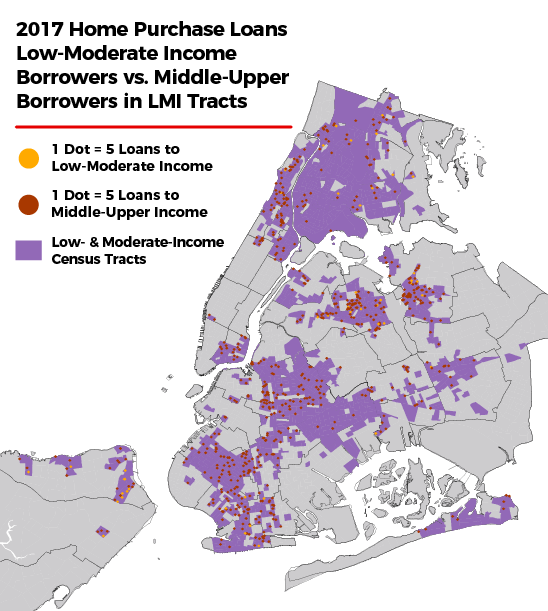
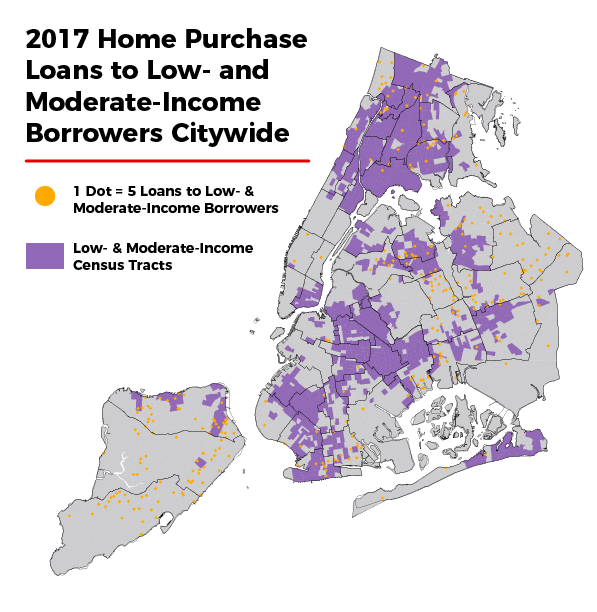
Similarly, we also note that very few loans to low- and moderate-income borrowers are in lower-income tracts, especially ones that are rapidly gentrifying and where displacement pressures on those families are growing, such as Williamsburg and Bedford Stuyvesant in Brooklyn, and upper Manhattan.
Racial Disparities Persist and Are Getting Worse
Twenty-two percent of New York City’s population is Black and 29% is Hispanic, yet fewer than 8% of all loans went to either group – figures that are below the prior four years. The denial rates – which refers to the percentage of applications that were denied by the lender9 – for Black and Hispanic borrowers continue to be higher than the rates of White and Asian borrowers, while origination rates are consistently lower, which refers to the percentage of applications that resulted in a loan being made. In 2017, 72% of loans to White and Asian borrowers were originated versus 61% of loans to Black borrowers and 65% of loans to Hispanic borrowers. Similarly, just 10% of loans to White borrowers and 12% to Asians were denied, versus 17% of loans to Black borrowers and 14% to Hispanics. These all changed very little from 2016.
That’s not to say there isn’t racial disparities within the Asian communities when it comes to lending. One of the changes to HMDA under Dodd Frank was to disaggregate the Asian and Pacific Islander category in order to establish a more nuanced understanding of mortgage lending and loan performance patterns across different Asian American and Pacific Islander communities.10 That has not yet gone into effect. Because there are great variations and disparities within the “Asian” category, including vastly different populations, the data makes it appear as though there is over-lending to this population (Asians make up 14% of the population, but received 28% of home purchase loans). Therefore, there may be more unequal lending practices than there appears.
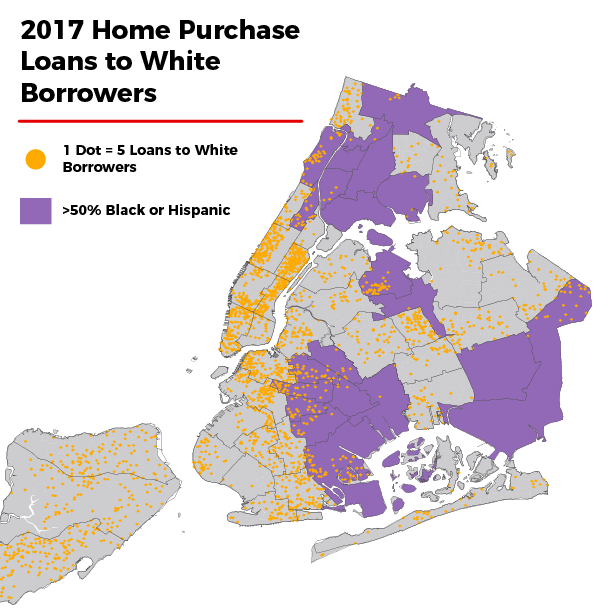
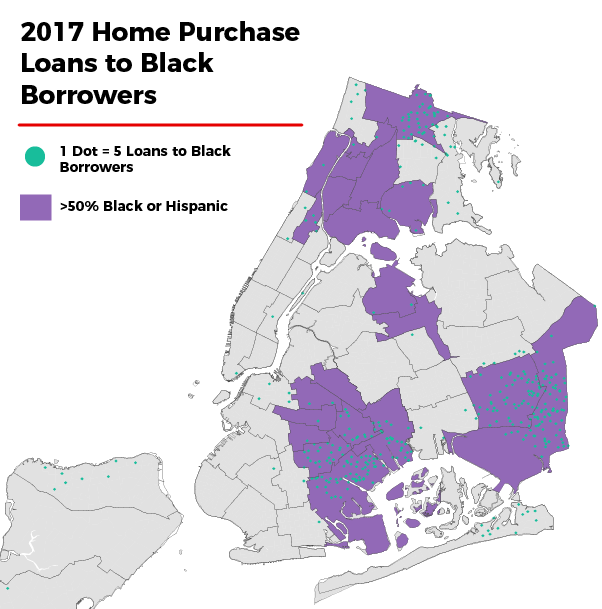
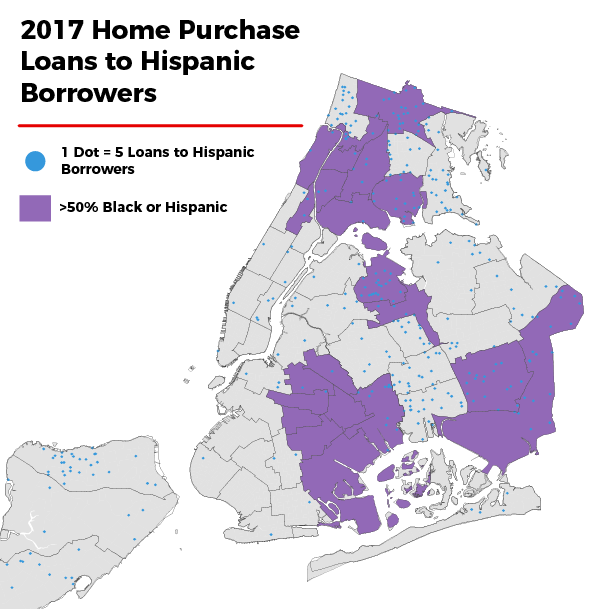
Similar to trends we see with low- and moderate-income borrowers, very few loans to Black borrowers are in lowand moderate-income tracts in gentrifying neighborhoods. Hispanic borrowers are more dispersed, but the volume of lending to both Black and Hispanic populations is well below that of Whites. Black borrowers seem concentrated in just a few predominantly Black neighborhoods, but notably absent are new loans in predominantly Black neighborhoods that are known to be gentrifying, such as Bedford Stuyvesant and Crown Heights.
New York City Home Purchase Loans in 2017
White Borrowers vs. Black Borrowers vs. Hispanic Borrowers
Infographic
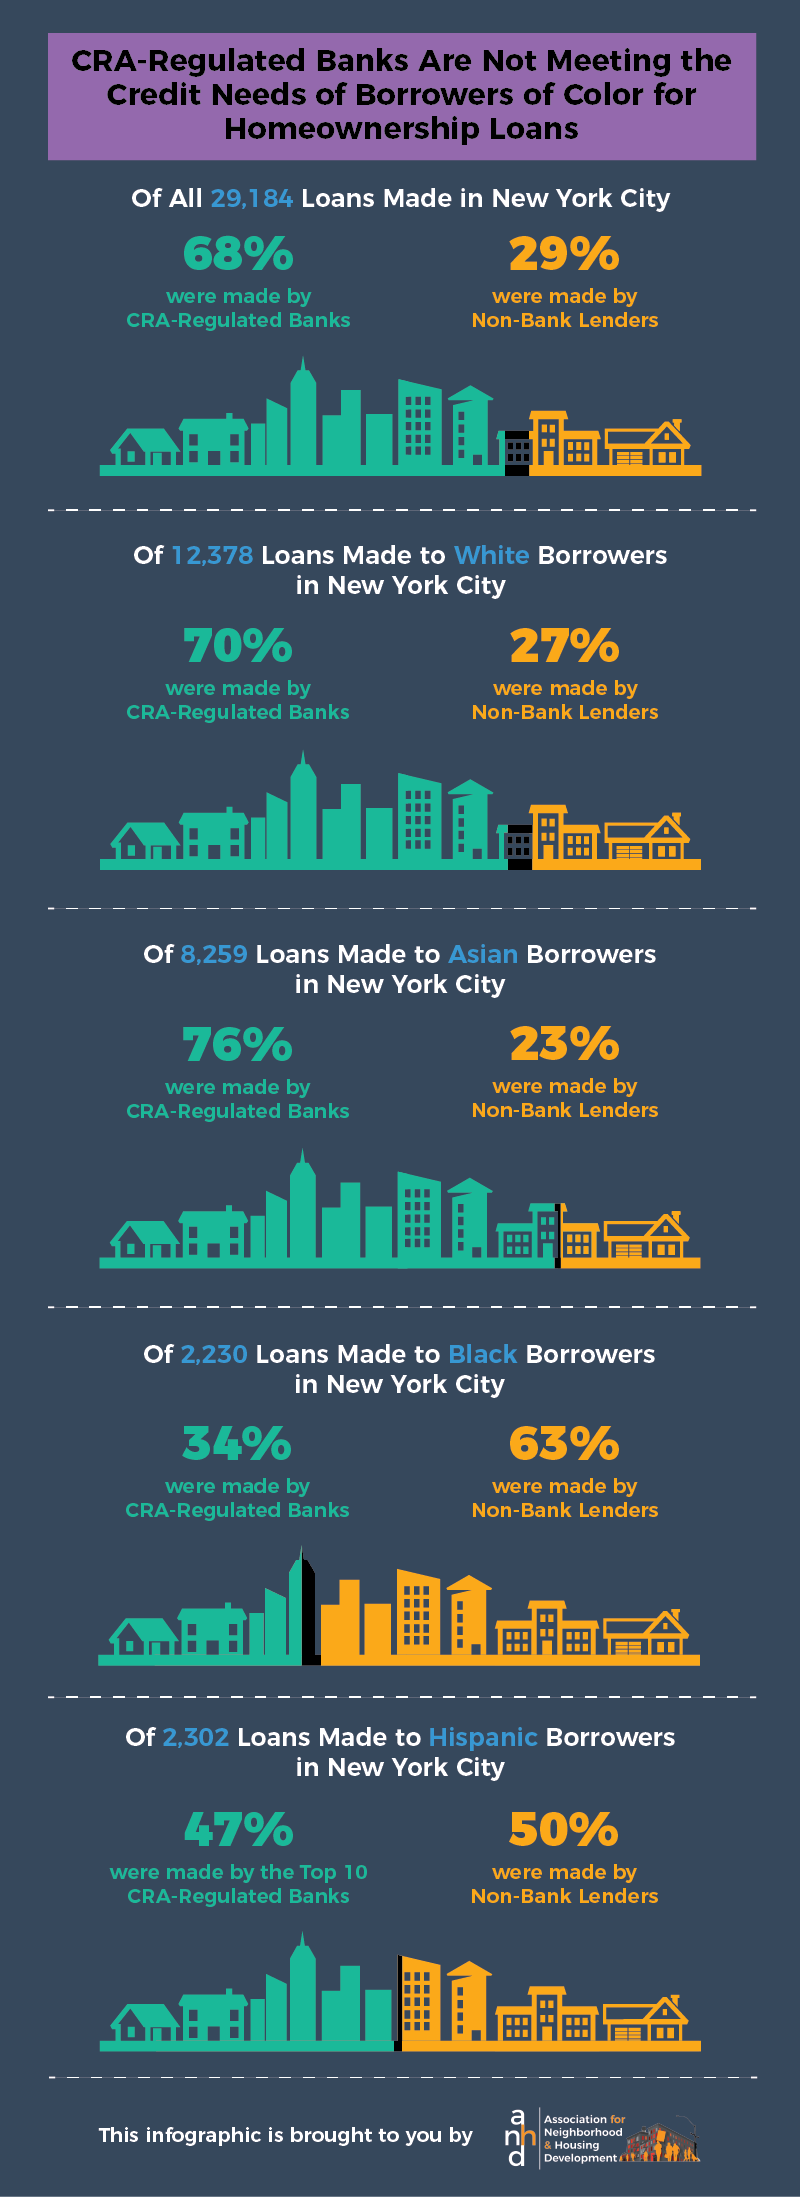
CRA-Regulated Banks Are Not Meeting the Credit Needs of Borrowers Of Color for Homeownership Loans
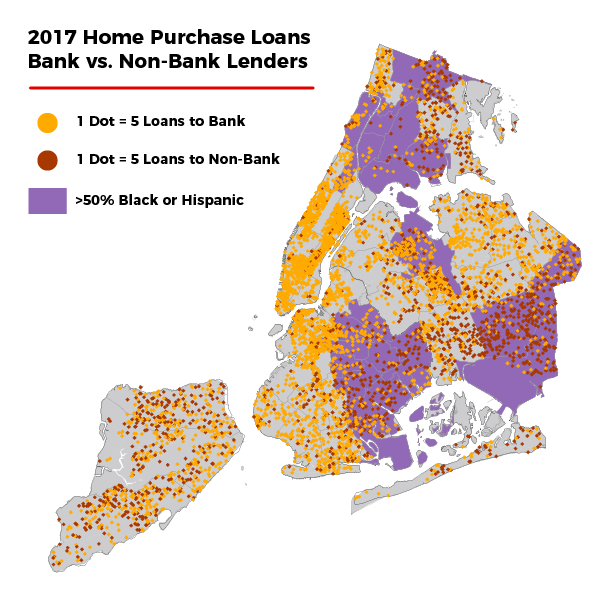
The starkest difference is in the percentage of CRA-regulated bank loans versus non-bank loans to Black and Hispanic borrowers.
CRA-Regulated Banks Are Not Meeting the Credit Needs of Borrowers of Color – Nonbanks Are Filling In the Gaps, Mostly FHA Loans
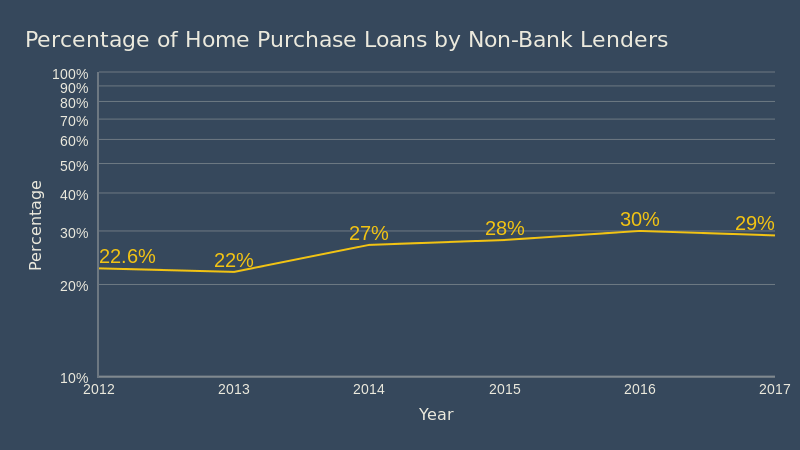 The percentage of non-bank lenders making home purchase lending is rising steadily in New York City, but it is still below nationwide levels at 56%.11 While this paper focuses on home purchase lending, we must note the rise in non-bank lenders in refinance lending where the percentages in New York City were much higher, matching national trends. Now, non-banks make up over 56% of all refinance loans, up from 42% in 2014.
The rise in non-bank lenders, particularly to borrowers of color, is concerning for a number of reasons. Non-banks are not nearly as heavily regulated as banks are. First and foremost, they do not have the same safety and soundness requirements that banks have. Under the CRA, banks are additionally required to make all of their CRA loans – to LMI borrowers and in LMI tracts – in a safe and sound manner. Also, non-banks do not have access to low-cost deposits like banks do and must rely upon other sources of capital, often short-term financing. Those other sources of capital can leave the financial system vulnerable since non-banks may have to act more aggressively to deliver higher rates of return for investors. If the CRA had an affirmative obligation to serve borrowers of color, banks would have an added incentive to be more proactive in lending to borrowers of color and those borrowers wouldn’t have to rely so heavily on non-bank lenders.
Three of the top 10 home purchase lenders in 2017 were non-bank lenders as were five of the top 10 refinance lenders. Quicken Loans once again made the most refinance loans in the city and Nationstar was third. Freedom Mortgage made the top 10 for both home purchase and refinance loans.
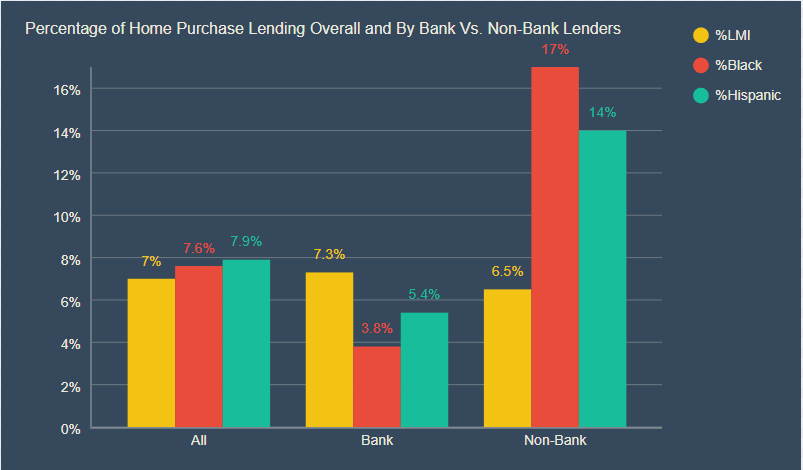 Perhaps due to the CRA’s obligation to lend to LMI borrowers, the percentage of loans to LMI borrowers is on par or higher at banks when compared to non-banks. In 2017, banks made a higher percentage of their loans to LMI borrowers than nonbanks did; 7.3% of all bank loans were to LMI borrowers versus 6.5% of nonbank lenders. In 2016, the percentages were almost the same among the two lender types: 8.3% at banks versus 8.5% at nonbanks. However, the difference in lending to borrowers of color and in communities of color is stark. It raises questions about fair lending, and underscores the need for better enforcement and new strategies to increase lending to underserved populations, including modernizing the CRA to include an affirmative obligation to serve borrowers of color. In 2017, for example, just 3.8% of CRAcovered bank loans went to Black borrowers and 5.4% to Hispanic borrowers, versus 17% and 14%, respectfully, at non-banks. Credit unions were in the middle, but their overall volume of lending is much lower.
Not surprisingly, the distribution of loans made by non-bank lenders largely matches lending to borrowers of color, particularly Black neighborhoods in southeast Queens and parts of Brooklyn. (See Methodology & Additional Data for the breakdown of loans by the Top 10 Banks and Non-Banks.)
 The CRA was passed in 1977 as a response to the racist policy of redlining and other discriminatory practices. Generations of racist policies and bias contribute to the racial wealth gap that persists today and play a major factor in the ability to purchase a home – lower earnings, less wealth, and lower credit scores, to name a few. Immigrants may face additional barriers, including language and cultural challenges as well as the lack of a credit score. According to a Pew Research Center study in 2014, the net worth of White households is 13 times that of Black households and 10 times that of Hispanic households.12 The Fiscal Policy Institute found that on average White families in New York State earned 77% more than Black families and 93% more than Hispanic families.13 This is in addition to outright discrimination and implicit bias in lending, such as the stories and data in a Reveal article and related study published earlier this year.
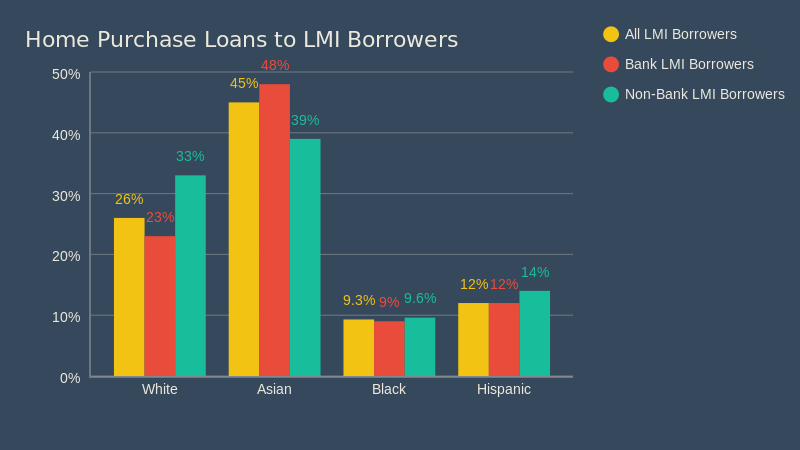
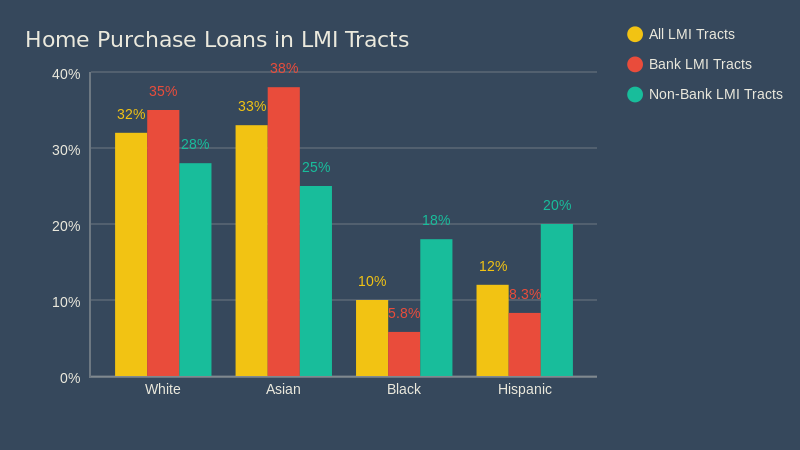
Despite this history, the law is color-blind and has not had a meaningful impact on the populations harmed by such policies. Our analysis shows that borrowers of color are disproportionately underrepresented in CRA loans, which as described earlier, are loans to low- and moderate-income borrowers or loans in low- and moderate-income tracts. Just 9% of loans made by CRA-covered banks to low- and moderate-income borrowers were Black and 12% were Hispanic. This is only slightly above the percentage of loans to Black and Hispanic borrowers citywide. In low- and moderate-income tracts, the percentage of loans by CRA-covered banks dropped to 5.8% to Black borrowers and 8.3% to Hispanic borrowers. The percentage of loans made by non-banks to Black and Hispanic borrowers was slightly higher among low- and moderate-income borrowers (9.6% to Black borrowers and 14% to Hispanic borrowers) and much higher among loans in low- and moderate-income tracts (18% to Black borrowers and 20% to Hispanic borrowers).
Percentage of Loans to Borrowers of Color Among “CRA loans”
CRA Loans are Loans to LMI Borrowers and Loans in LMI Tracts – There is Overlap
One of the primary reasons for the disparities among banks and non-banks is that banks have all but pulled out of offering loans backed by the Federal Housing Administration (FHA), which are the predominant source of loans for borrowers of color. But banks have not replaced that product or their approach in order to meet the credit needs of borrowers of color. A recent report by the Center for Responsible Lending (CRL) goes in-depth into this twotiered system where borrowers of color are locked out of conventional mortgages and left with FHA loans.15 While FHA loans can be an important source of access due to lower down payment requirements and lower credit scores, they are also often more expensive than conventional mortgages, largely due to the private mortgage insurance that lasts at least 11 years and in some cases for the life of the loan. The CRL report also points out that additional requirements made by individual lenders (known as “lender overlays”) that require higher credit scores or debt-toincome ratios than the FHA does could be locking people out of the market entirely, which is also likely given the low rates of loans to borrowers of color. Lastly, many borrowers of color are not low- or moderate-income, and may be eligible for conventional loans. FHA loans are not the predatory subprime loans we saw leading up to the housing crisis – the HMDA data shows that many of them just crossed the threshold that classifies them as a highcost category, but the fact remains that they are higher cost than the average loan. The high rate of FHA loans that are not made to low- and moderate- income borrowers raises concerns that some borrowers are not being made aware of other options, or worse, are being steered into this more expensive product when they could qualify for a conventional loan or a lower-cost CRA loan if they meet the requirements.
Conclusion
Responsible homeownership is one important method of asset building that can have positive impacts for generations to come. But, as this report demonstrates, too many people are being left behind in accessing homeownership. Addressing these disparities will require a concerted effort on the part of government, banks, and bank regulators. This report comes at a critical moment as we are 10 years out from the 2008 financial crisis, which was caused by irresponsible lending. Meanwhile, bank regulators are contemplating the biggest overhaul of the CRA in over two decades.
- Government should invest in creating homeownership opportunities, including but not limited to, building affordable homes to purchase, subsidizing the transfer of distressed mortgages to underserved populations, and investing in community land trusts.
- Increase access to financial assistance, through both bank funds and government funds for low- and moderate-income people and communities, as well as people of color of all incomes who been locked out of homeownership for a multitude of reasons.
- Increase access to homeownership and financial counseling. Nonprofit housing counselors have a good understanding of quality programs that responsibly give lower-income people a chance at homeownership.
- Banks must offer and market a range of products geared towards underserved populations – CRA loan products, SONYMA loans, and FHA loans. CRA loans should be affordable, waive Private Mortgage Insurance (PMI), include financial assistance, and connect people to pre-purchase counseling. Banks should also have appropriate staff and resources to outreach, market, and support potential homebuyers.
- Modernize the CRA. The CRA never should have been color-blind. It should be expanded to have an affirmative obligation to meet the credit needs of people and communities of color.
- Expand and preserve HMDA. HMDA is the most important transparency tool we have to uncover disparities and discrimination in the mortgage market. The CFPB must swiftly implement and make transparent the new data points. Our legislators should reverse the damage done by S. 2155 so that all HMDA reporting lenders are once again required to report on the expanded data reporting requirements.
It is imperative for the City and financial institutions to exhaust all options in order to make affordable rental and homeownership opportunities available to lower-income and minority borrowers.