Key Findings
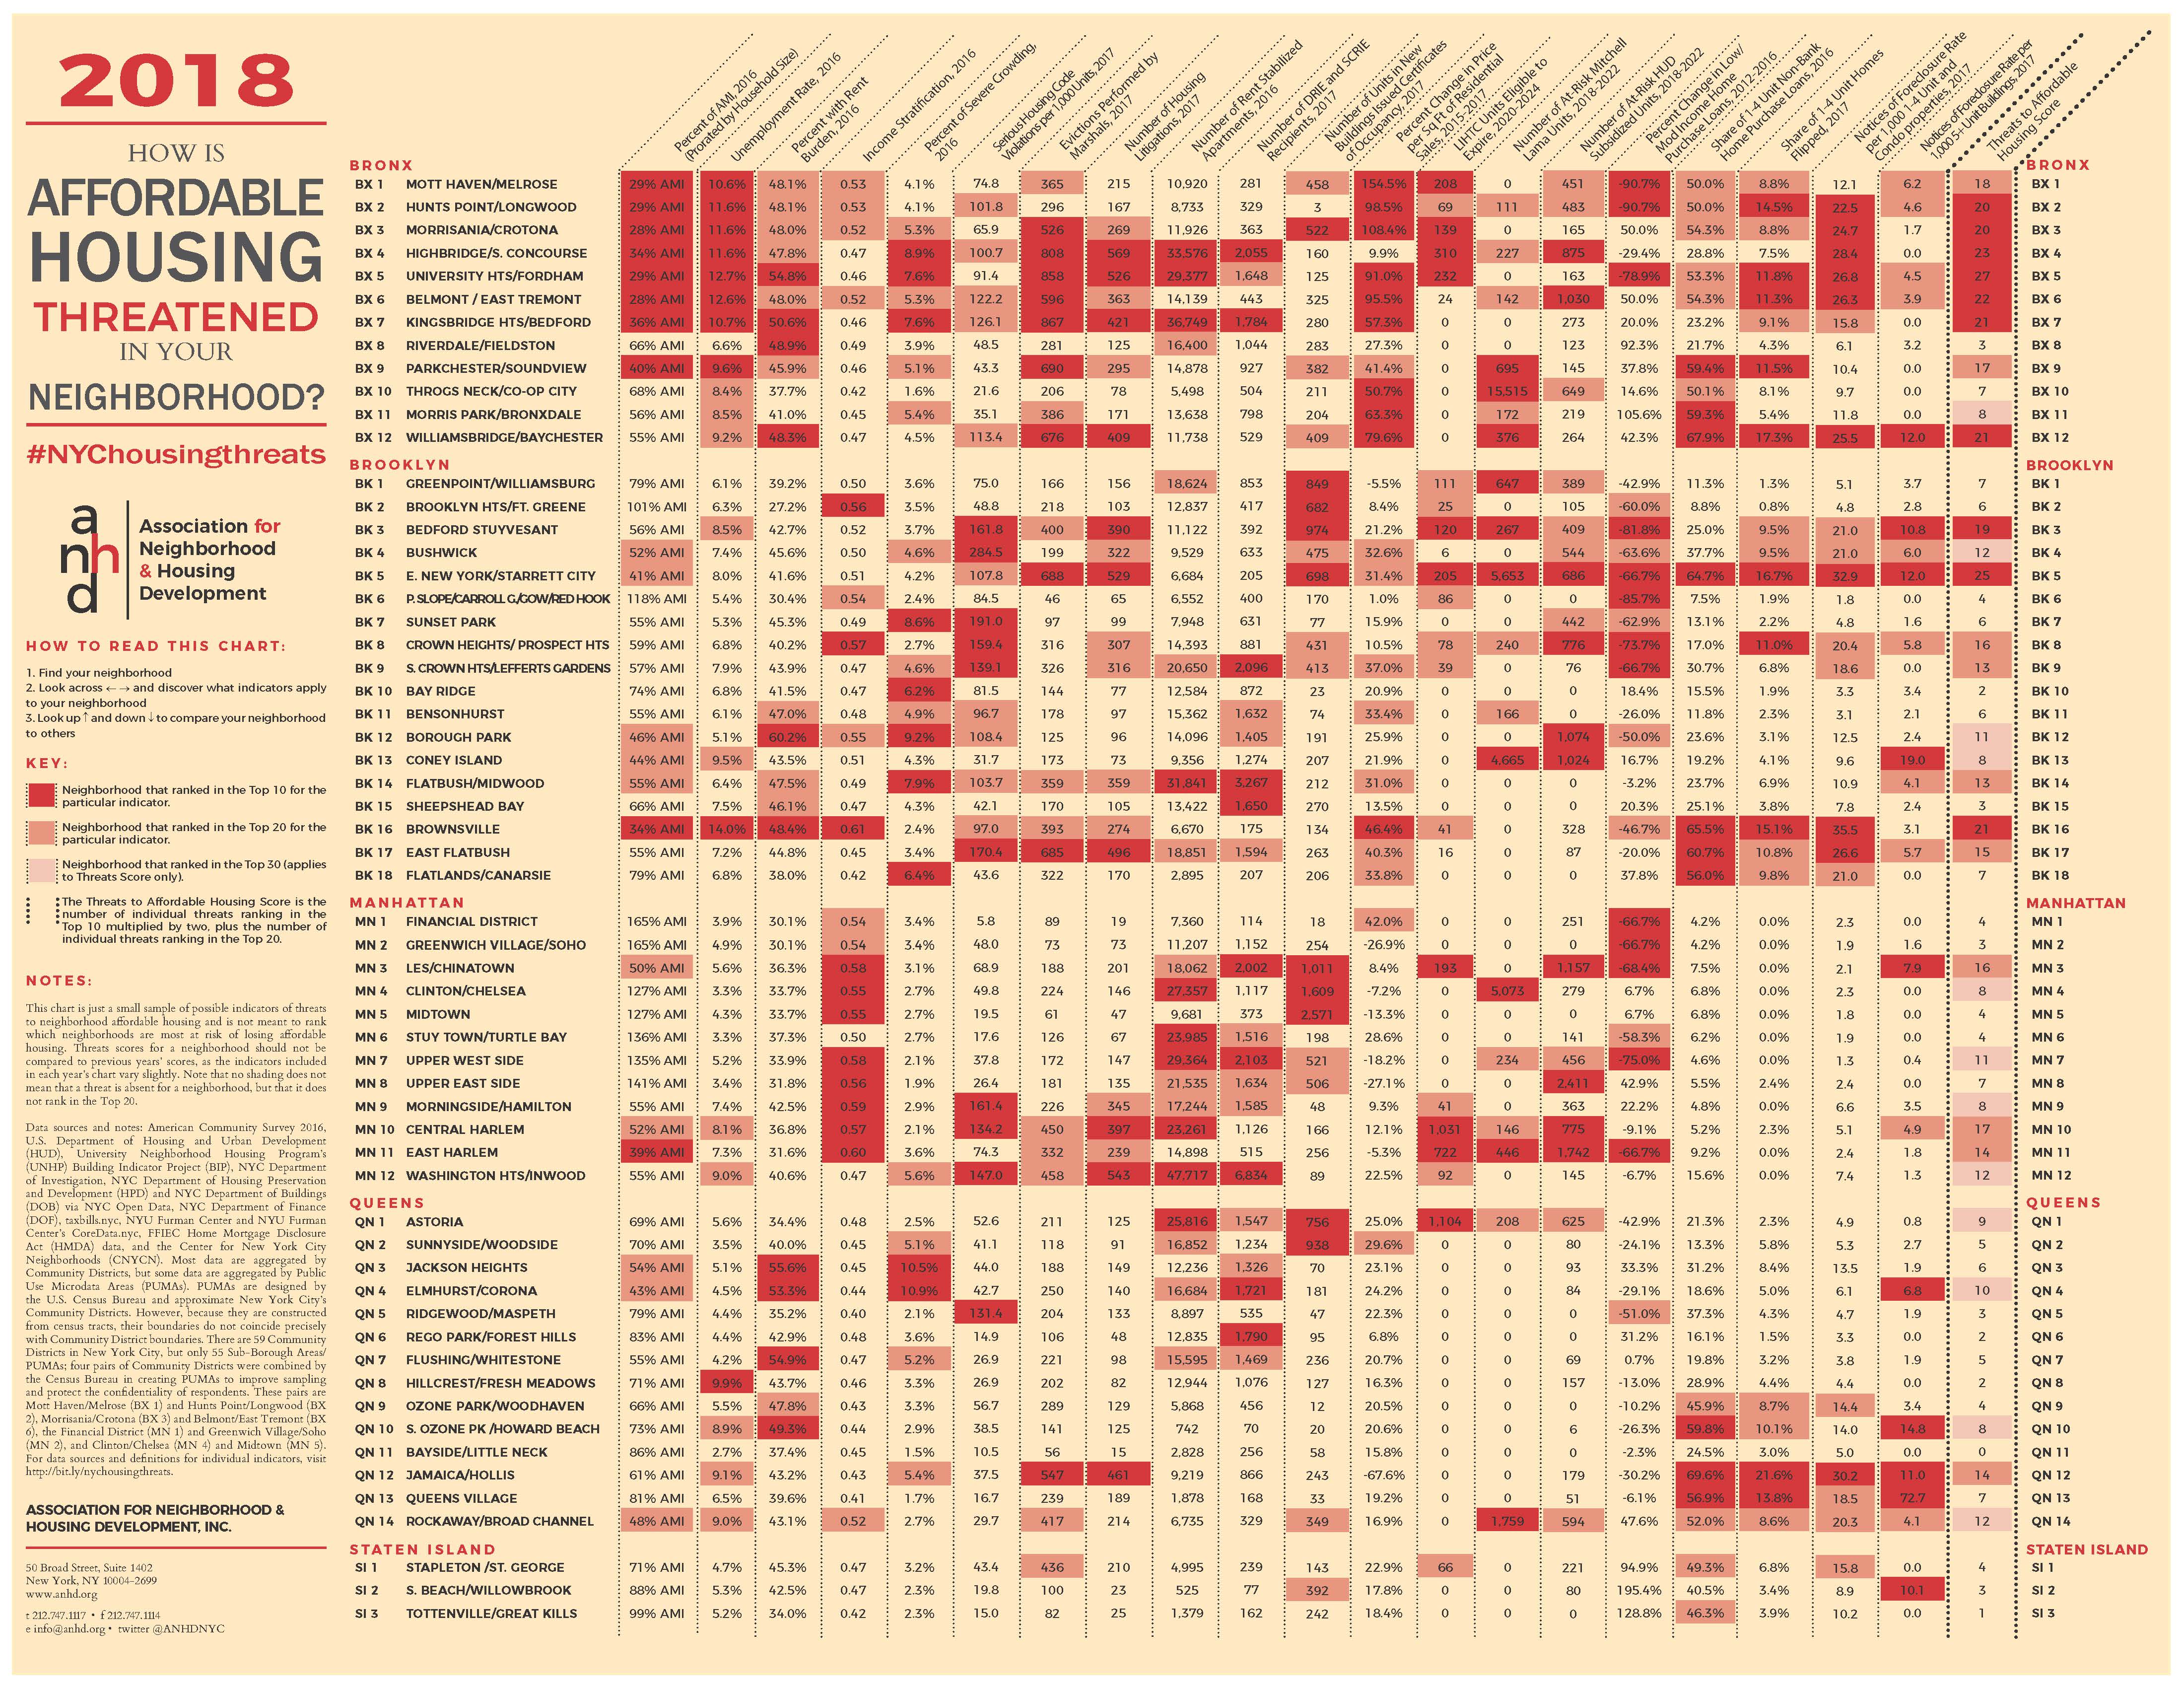
The City is losing affordable rent stabilized units at a rapid rate. And, it is especially bad in some neighborhoods – Astoria lost the most stabilized units between 2015 and 2016 (634), followed by Central Harlem (500) and Bedford Stuyvesant (460).
Expiring City-backed affordable housing is a growing problem. Low-Income Housing Tax Credit (LIHTC) units eligible to expire in the coming years are concentrated in Astoria and Central Harlem, each with over 1,000 units.
Expiring Federally-backed affordable units are a problem. Buildings at risk of losing U.S. Department of Housing and Urban Development (HUD) subsidies for affordability are primarily in the Upper West Side, East Harlem, and the Lower East Side/Chinatown.
Fast-paced residential development can put pressure on existing residents by increasing land values and rents. In Manhattan, the top neighborhoods with new residential units approved are Midtown, Clinton/Chelsea, and the Lower East Side/Chinatown – over 1,000 units in each of those districts in 2017 alone. In Brooklyn, Bedford Stuyvesant had the most new residential units approved, with over 1,000 new units in 2017.
It’s getting harder and harder for working people to afford homes. Brooklyn had some of the biggest drops in the number of home purchase loans made to low- and moderate-income buyers. Declining numbers in Bedford Stuyvesant (-81.8%) and Park Slope/Gowanus/Red Hook (-85.7%) show homeownership is increasingly out of reach for many New Yorkers, especially New Yorkers from communities of color.
What People Are Saying About the Chart
“The crisis of affordable housing is so much part of the daily experience of almost all New Yorkers that it’s the water we swim in. But some people and some neighborhoods are experiencing the crisis and the displacement pressure more severely, and with more devastating consequences to their families and their communities.” said Benjamin Dulchin, the Executive Director of the Association for Neighborhood and Housing Development. “This year’s Housing Risk Chart shows the many ways and many neighborhoods where City policy must do a better job preserving our affordable housing.”
“The data presented by ANHD highlights the critical need to protect and preserve existing affordable housing. Low-income residents of East Harlem, Central Harlem, and neighborhoods throughout the city are increasingly at-risk of losing their homes and being uprooted from their communities,” said Chris Cirillo, Executive Director at Ascendant Neighborhood Development Corporation. “The City must re-double its housing preservation efforts to ensure that there is no net loss of affordable housing and that residents can stay in the neighborhoods that they call home.”
“Sound the alarm! The release of the risk chart confirms the severity of our affordable housing and homelessness crisis across the city. The decision to rezone black and brown communities is a triage approach that will only exacerbate displacement to already vulnerable neighborhoods like Highbridge and the South Concourse. This crisis will continue to worsen, unless we follow the lead of organizations on the ground,” said Carmen Vega-Rivera, a Leader with CASA: Community Action for Safe Apartments.
“Working class and moderate income communities, particularly neighborhoods of color, are increasingly being victimized by policies that encourage displacement of families who have made those communities home, in some cases for generations,” said Delsenia Glover, Director of Education and Organizing at Tenants & Neighbors. “Escalating rents and loopholes in the rent laws, like vacancy bonuses and preferential rents, are creating rapid turnover of apartments and even whole streets and neighborhoods like a gentrification steamroller. The creation and retention of affordable housing has never kept pace with the number of New Yorkers in need of it, but the chasm between those numbers is growing like a wildfire. What we need is a pro-active and deeply affordable city housing plan to preserve an economically and racially diverse New York City.”
“We are gravely concerned about the accelerating loss of rent-regulated housing throughout Harlem,” said Larry Wood of the Goddard Riverside Law Project. “The data collected by ANHD highlights the scale of this loss, which we have observed as advocates and our clients continue to experience first-hand as they struggle to preserve their homes and maintain their communities. We are hopeful that the newly implemented Right to Counsel program will slow the loss of rent-regulated housing in Harlem, but we have to remain vigilant and continue fighting to preserve affordable housing.”
“What we are seeing in HUD-subsidized housing in gentrifying neighborhoods is that landlords are avoiding entering into long-term contracts or extensions of their contracts, which leaves residents wondering how long their housing will remain affordable,” said Gloria Villatoro, Vista Organizer at UHAB. “The tenants who suffer the most are the elderly, people with disabilities, or formerly homeless families. Stable housing is particularly important for these residents, and living with insecurity takes a serious toll on them.”
Data Sources & Definitions
Percent of AMI, 2016 (Prorated by Household Size)
To calculate the local Area Median Income (AMI) level, the median household income of a community district (PUMA) is adjusted/prorated by its average household size and compared to the HUD-determined income limits for the entire New York Metro Fair Market Rent Area. Source: American Community Survey (ACS) DP03 and S1101 2016 1-Year estimates; U.S. Department of Housing and Urban Development 2018 Income Limits Documentation.
Unemployment Rate, 2016
Rate of unemployment for people 16 years and older in the civilian labor force. Source: ACS S2301 1-Year estimates.
Percent with Rent Burden, 2016
Percent of households paying more than 30% of income towards gross rent. Source: ACS B25070 1-Year estimates.
Income Stratification, 2016
Income stratification is measured by the Gini coefficient, an indicator of income distribution among a population. A higher coefficient indicates a greater wealth gap, 1 representing total inequality and 0 representing perfect equality. Source: ACS B19083 2016 1-Year Estimates.
Percent of Severe Crowding, 2016
Percentage of renter households with 1.5 or more occupants per room. Source: ACS S2501 5-Year estimates.
Serious Housing Code Violations per 1,000 Units, 2017
Open Class C violations per 1,000 units in multifamily (5+ unit) buildings. Source: University Neighborhood Housing Program’s (UNHP) Building Indicator Project (BIP), October-December 2017.
Evictions Performed by Marshals, 2017
Number of individual evictions recorded by marshals. Records with duplicate dates, addresses, unit numbers, and marshal names are assumed to be one eviction. Source: NYC Department of Investigation.
Number of Housing Litigations, 2017
Housing Court actions initiated by HPD against owners of privately-owned buildings or initiated by tenants against private owners. Source: NYC Department of Housing Preservation and Development (HPD) Open Data.
Number of Rent Stabilized Apartments, 2016
Number of rent stabilized apartments, pulled from NYC Department of Finance (DOF) property tax bills. Source: taxbills.nyc.
Number of DRIE and SCRIE Recipients, 2017
Number of tenants with active DRIE or SCRIE benefits in 2017. Source: NYC DOF.
Number of Units in New Buildings issued Certificates of Occupancy, 2017
Number of residential units in all new buildings issued Certificates of Occupancy. Source: NYC Department of Buildings (DOB) Open Data.
Percent Change in Price per Sq Ft of Residential Sales, 2015-2017
Change in Price per Square Foot of Residential Sales from 2015 to 2017. Sales prices and recorded gross square footage of 0 are excluded. Source: DOF Rolling Sales.
LIHTC Units Eligible to Expire, 2020-2024
Number of units in buildings receiving Low Income Housing Tax Credits (4% or 9%) that are eligible to expire between 2020-2024, inclusive. Data is current as of December 2016. Since then some properties may have renewed affordability agreements, meaning the number of units set to expire may be lower than shown. Source: NYU Furman Center’s CoreData.nyc.
Number of At-Risk Mitchell Lama Units
Data is current as of December 2016. Mitchell Lama buildings with opt-out dates within 5 years of January 1, 2018 are classified as at-risk. Some of these buildings may have other financing that lasts longer, meaning the number of units with overall expiring affordability requirements could be lower than shown. Some buildings not reflected in the data may actually be at risk due to an owner option to pre-pay earlier than the expiration date. Source: NYU Furman Center’s CoreData.nyc.
Number of At-Risk HUD Subsidized Units, 2018-2022
Buildings with a Project-Based Section 8 contract expiring within 2 years, a HUD-insured mortgage expiring within 5 years, and/or a RAP or Rent Supplement contract are classified as at-risk. Source: HUD Multifamily Assistance and Section 8 Contracts and Mortgages Currently Insured databases.
Percent Change in Low/Mod Income Home Purchase Loans, 2012-2016
Percent change in number of loans made to Low and Moderate Income borrowers. Source: FFIEC Home Mortgage Disclosure Act (HMDA).
Share of 1-4 Unit Non-Bank Home Purchase Loans, 2015
Number of 1-4 unit home purchase loans made by independent lenders (non-bank, excluding credit unions), whom are not covered by the Community Reinvestment Act, as a share of all home purchase loans. Source: HMDA.
Share of 1-4 Unit Homes Flipped, 2017
Number of 1-4 family homes sold within one year as a share of all 1-4 family home sales. Properties recorded as having less than 500 gross square feet and/or a sale price equal to or less than $100,000 are excluded. Source: Center for New York City Neighborhoods (CNYCN).
Notices of Foreclosure Rate per 1,000 1-4 Unit and Condo properties, 2017
Number of foreclosure notices per 1,000 1-4 unit and condo residential properties. Source: Public Use Data Corporation, NYU Furman Center.
Notices of Foreclosure Rate per 1,000 5+ Unit Buildings, 2017
Number of foreclosure notices per 1,000 multifamily (5+ unit) residential properties. Source: Public Use Data Corporation, NYU Furman Center.
PUMAs and Community Districts
Public Use Microdata Areas (PUMAs) are designed by the U.S. Census Bureau and approximate New York’s Community Districts. However, because they are constructed from census tracts, their boundaries do not coincide precisely with Community District boundaries. There are 59 Community Districts in New York but only 55 Sub-Borough Areas/PUMAs. Click here for details.