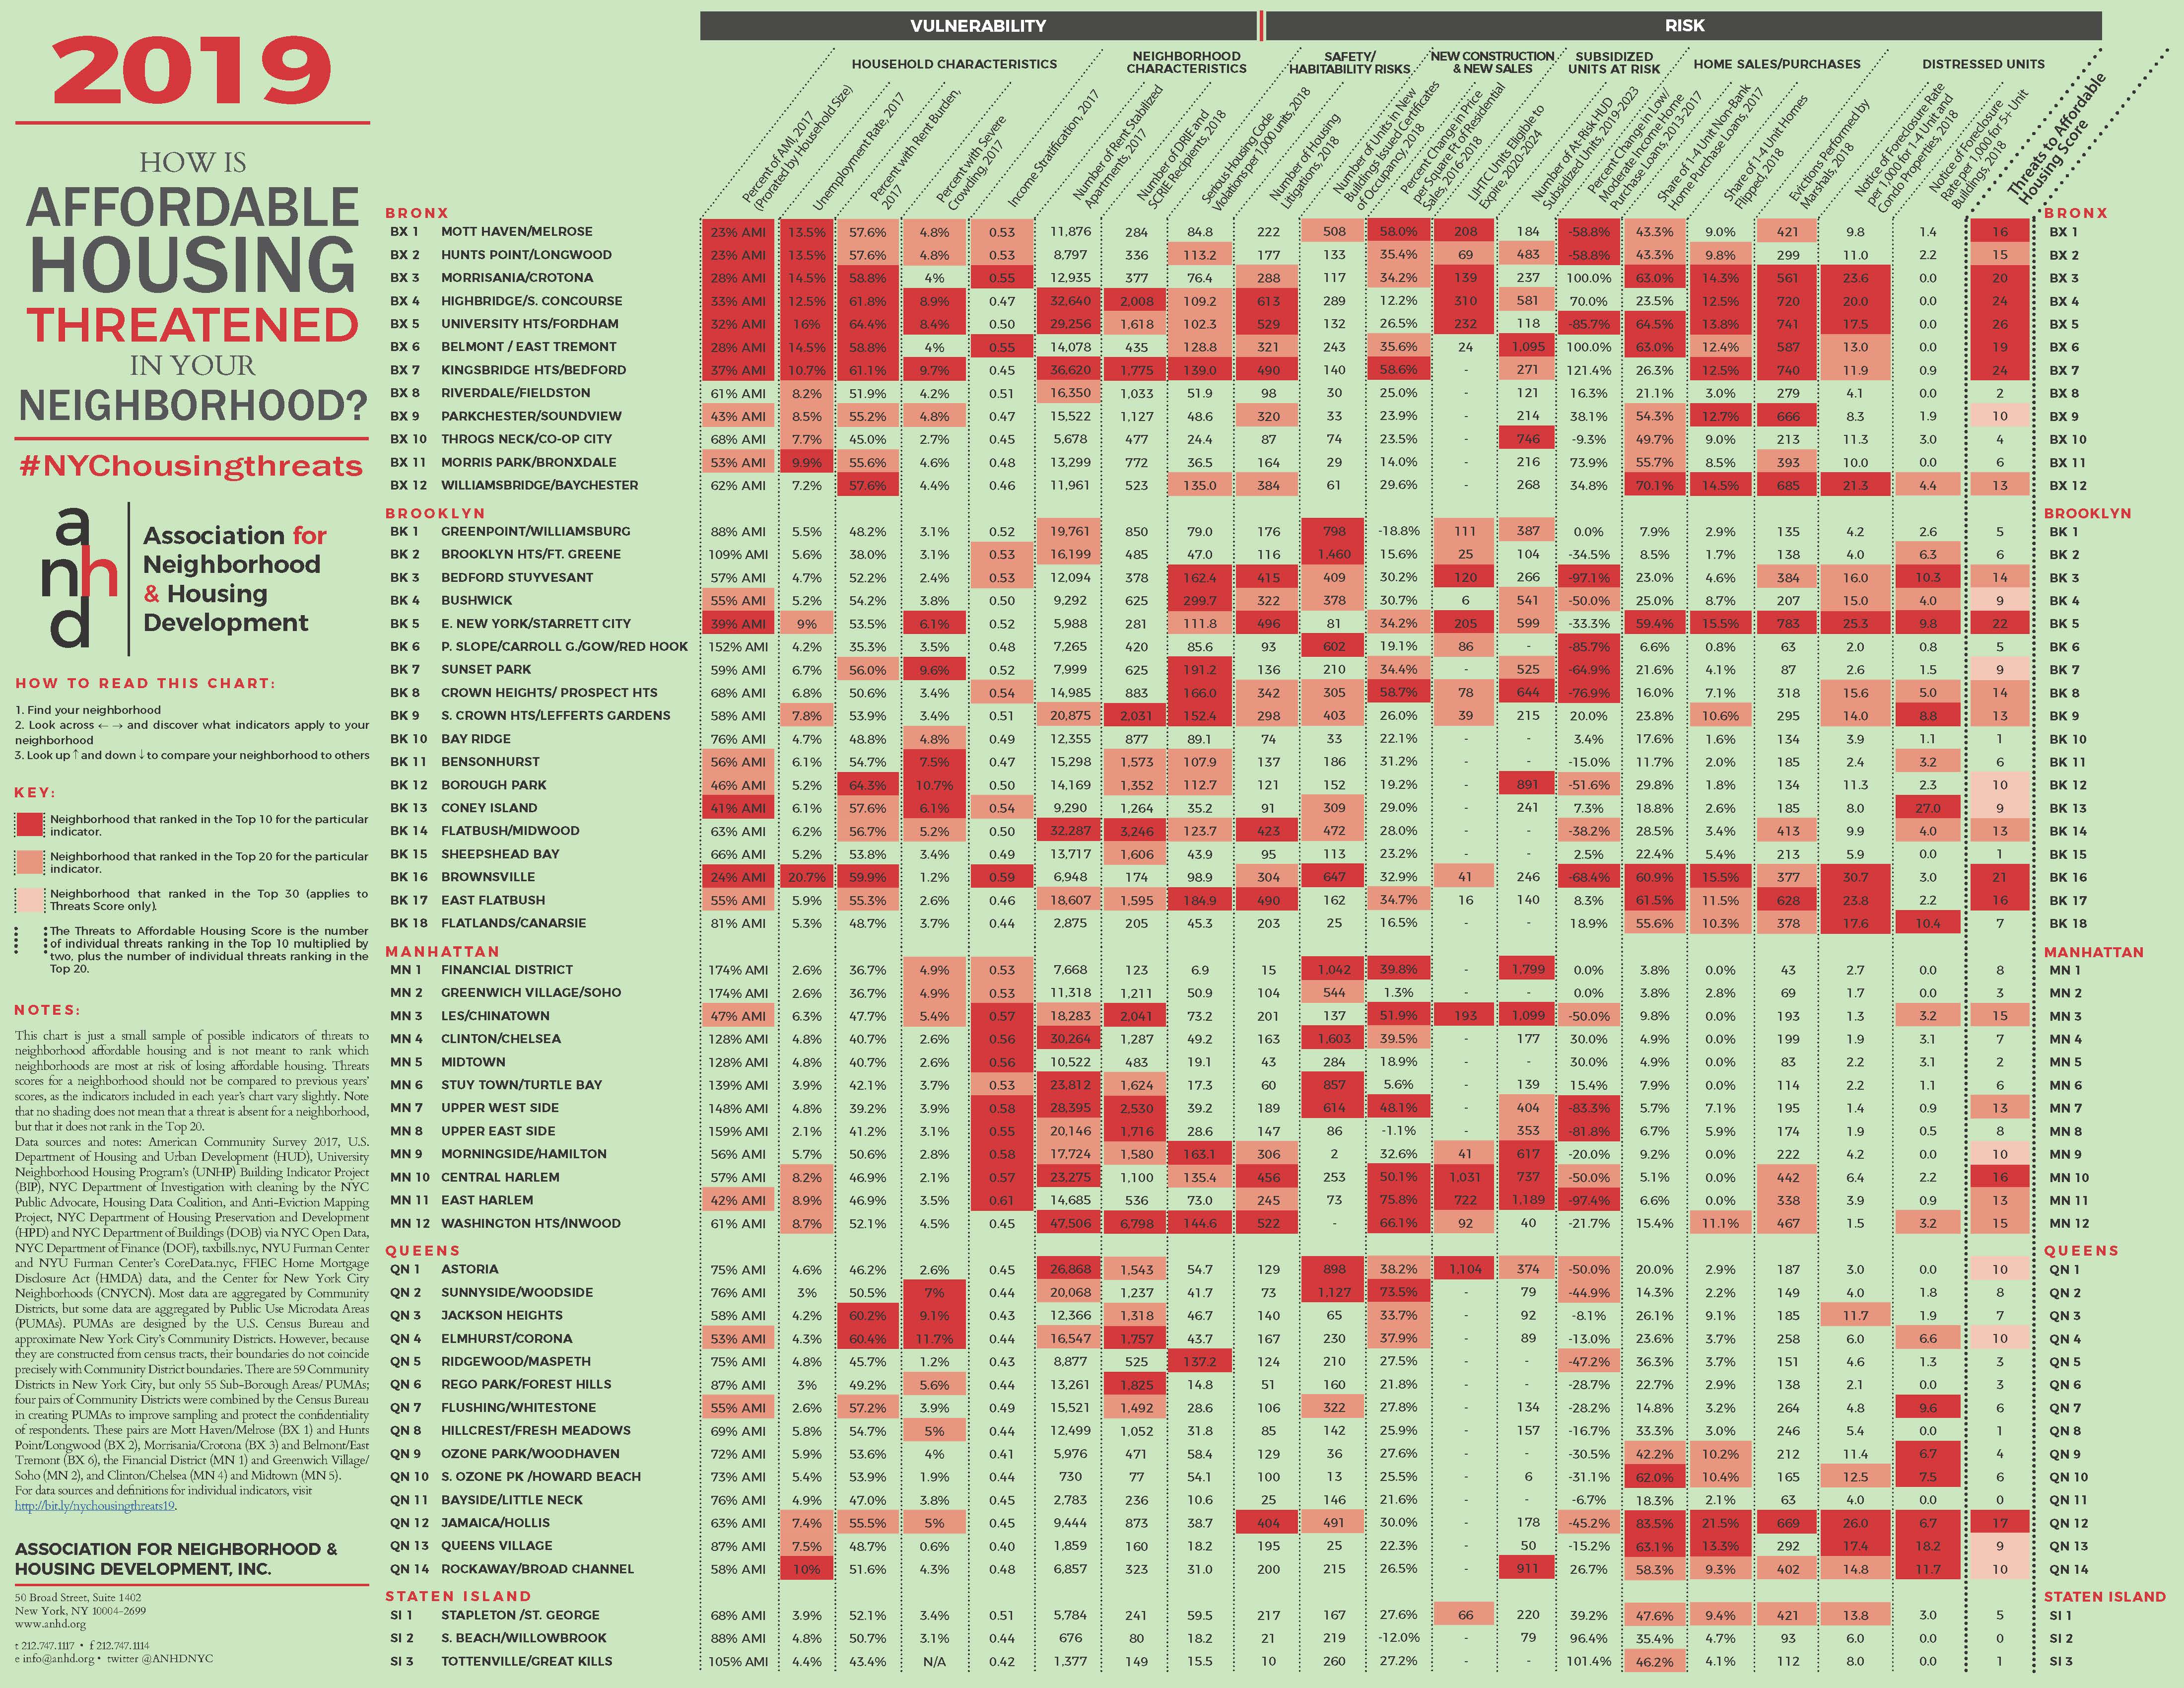
Key Findings
A shocking number of New Yorkers are rent burdened. This is especially bad in the University Heights/Fordham neighborhoods, where 64.4% of residents are rent burdened.
Severe overcrowding is a persistent problem. Elmhurst/Corona has the highest rate of overcrowding – 11.7%, and Borough Park had the 2nd highest rate at 10.7%.
Building prices are rising rapidly in some neighborhoods, and that speculation is putting pressure on tenants. East Harlem saw the biggest jump in property prices per square foot – 75.8% – and that neighborhood also had the greatest income stratification of any community.
Some neighborhoods are suffering from a high concentration of serious housing code violations. Bushwick was the most impacted by serious housing code violations, followed by Sunset Park.
Home foreclosures remain a significant issue in some communities. Brownsville had the highest rate of home foreclosure, but Jamaica/Hollis and East New York are also highly impacted.
Data Sources & Definitions
Percent of AMI, 2017 (Prorated by Household Size)
To calculate the local Area Median Income (AMI) level, the median household income of a community district (PUMA) is adjusted/prorated by its average household size and compared to the HUD-determined income limits for the entire New York Metro Fair Market Rent Area. Source: American Community Survey (ACS) DP03 and S1101 2017 1-Year estimates; U.S. Department of Housing and Urban Development 2018 Income Limits Documentation.
Unemployment Rate, 2017
Rate of unemployment for people 16 years and older in the civilian labor force. Source: ACS S2301 1-Year estimates.
Percent with Rent Burden, 2017
Percent of households paying more than 30% of income towards gross rent. Source: ACS B25070 1-Year estimates.
Income Stratification, 2017
Income stratification is measured by the Gini coefficient, an indicator of income distribution among a population. A higher coefficient indicates a greater wealth gap, 1 representing total inequality and 0 representing perfect equality. Source: ACS B19083 1-Year Estimates.
Percent of Severe Crowding, 2017
Percentage of renter households with 1.5 or more occupants per room. Source: ACS S2501 1-Year estimates.
Serious Housing Code Violations per 1,000 Units, 2018
Open Class C violations per 1,000 units in multifamily (5+ unit) buildings. Source: University Neighborhood Housing Program’s (UNHP) Building Indicator Project (BIP), October-December 2018.
Evictions Performed by Marshals, 2018
Number of individual evictions recorded by marshals. Records with duplicate dates, addresses, unit numbers, and marshal names are assumed to be one eviction. Source: NYC Marshals/Department of Investigations. Data cleaning, geocoding, and validation by the Public Advocate’s Office, Housing Data Coalition and Anti-Eviction Mapping Project. (CC BY NC SA 4.0)
Number of Housing Litigations, 2018
Housing Court actions initiated by HPD against owners of privately-owned buildings or initiated by tenants against private owners. Source: NYC Department of Housing Preservation and Development (HPD) Open Data.
Number of Rent Stabilized Apartments, 2017
Number of rent stabilized apartments, pulled from NYC Department of Finance (DOF) property tax bills. Source: taxbills.nyc.
Number of DRIE and SCRIE Recipients, 2018
Number of tenants with active DRIE or SCRIE benefits in 2018. Source: NYC DOF.
Number of Units in New Buildings issued Certificates of Occupancy, 2018
Number of residential units in all new buildings issued Certificates of Occupancy. Source: NYC Department of Buildings (DOB) Open Data.
Percent Change in Price per Sq Ft of Residential Sales, 2016-2018
Change in Price per Square Foot of Residential Sales from 2016 to 2018. Sales prices and recorded gross square footage of 0 are excluded. Source: DOF Rolling Sales.
LIHTC Units Eligible to Expire, 2020-2024
Number of units in buildings receiving Low Income Housing Tax Credits (4% or 9%) that are eligible to expire between 2020-2024, inclusive. Data is current as of December 2016. Since then some properties may have renewed affordability agreements, meaning the number of units set to expire may be lower than shown. Source: NYU Furman Center’s CoreData.nyc.
Number of At-Risk HUD Subsidized Units, 2019-2023
Buildings with a Project-Based Section 8 contract expiring within 2 years, a HUD-insured mortgage expiring within 5 years, and/or a RAP or Rent Supplement contract are classified as at-risk. Source: HUD Multifamily Assistance and Section 8 Contracts and Mortgages Currently Insured databases.
Percent Change in Low/Mod Income Home Purchase Loans, 2013-2017
Percent change in number of loans made to Low and Moderate Income borrowers. Source: FFIEC Home Mortgage Disclosure Act (HMDA).
Share of 1-4 Unit Non-Bank Home Purchase Loans, 2017
Number of 1-4 unit home purchase loans made by independent lenders (non-bank, excluding credit unions), whom are not covered by the Community Reinvestment Act, as a share of all home purchase loans. Source: HMDA.
Share of 1-4 Unit Homes Flipped, 2018
Number of 1-4 family homes sold within one year as a share of all 1-4 family home sales. Properties recorded as having less than 500 gross square feet and/or a sale price equal to or less than $100,000 are excluded. Source: Center for New York City Neighborhoods (CNYCN).
Notices of Foreclosure Rate per 1,000 1-4 Unit and Condo properties, 2018
Number of foreclosure notices per 1,000 1-4 unit and condo residential properties. Source: Public Use Data Corporation, NYU Furman Center.
Notices of Foreclosure Rate per 1,000 5+ Unit Buildings, 2018
Number of foreclosure notices per 1,000 multifamily (5+ unit) residential properties. Source: Public Use Data Corporation, NYU Furman Center.
PUMAs and Community Districts
Public Use Microdata Areas (PUMAs) are designed by the U.S. Census Bureau and approximate New York’s Community Districts. However, because they are constructed from census tracts, their boundaries do not coincide precisely with Community District boundaries. There are 59 Community Districts in New York but only 55 Sub-Borough Areas/PUMAs.