The 2022 AMI Cheat Sheet
To better understand how AMIs translate to actual incomes and rents for New Yorkers, ANHD regularly releases our AMI Cheat Sheet as a convenient tool for local residents, community-based organizations, and decision makers. The new AMI Cheat Sheet also shows the share of rent-burdened households at every AMI level, to show who actually needs affordable housing the most. The 2022 version of our AMI Cheat Sheet can be downloaded here and printed as a tri-fold brochure.
Keep reading for ANHD’s new analysis of what the Cheat Sheet shows us, and what our City really needs.
What is AMI, really?
Each year, the U.S. Department of Housing and Urban Development (HUD) publishes “Income Limits” for metropolitan areas based on median family incomes. Policy makers, local governments, and housing developers refer to this metric as the Area Median Income, or AMI. With 100% AMI as a benchmark, each household in a metropolitan area can be assigned an AMI level based on their income and household size. For example, this year, 100% AMI for a three-person household in New York City is $120,100. If a three-person household makes $45,000, that would be the equivalent of 37% AMI. Housing developments are often marketed in 10% AMI increments, so this household would generally be eligible for a 40% AMI unit.
Rather than directly applying income statistics from the Census, HUD takes this data and adds a series of complicated adjustments. These adjustments play an influential role in housing policy outcomes, because AMI is used by government agencies to determine who qualifies for affordable housing, and at what rent. Government-financed affordable housing projects, as well as individual voucher programs, use AMI to determine eligibility. For example, eligibility for Mandatory Inclusionary Housing, 421-a, Low Income Housing Tax Credits, and Section 8 are all based on AMI.
What does this year’s AMI Cheat Sheet tell us?
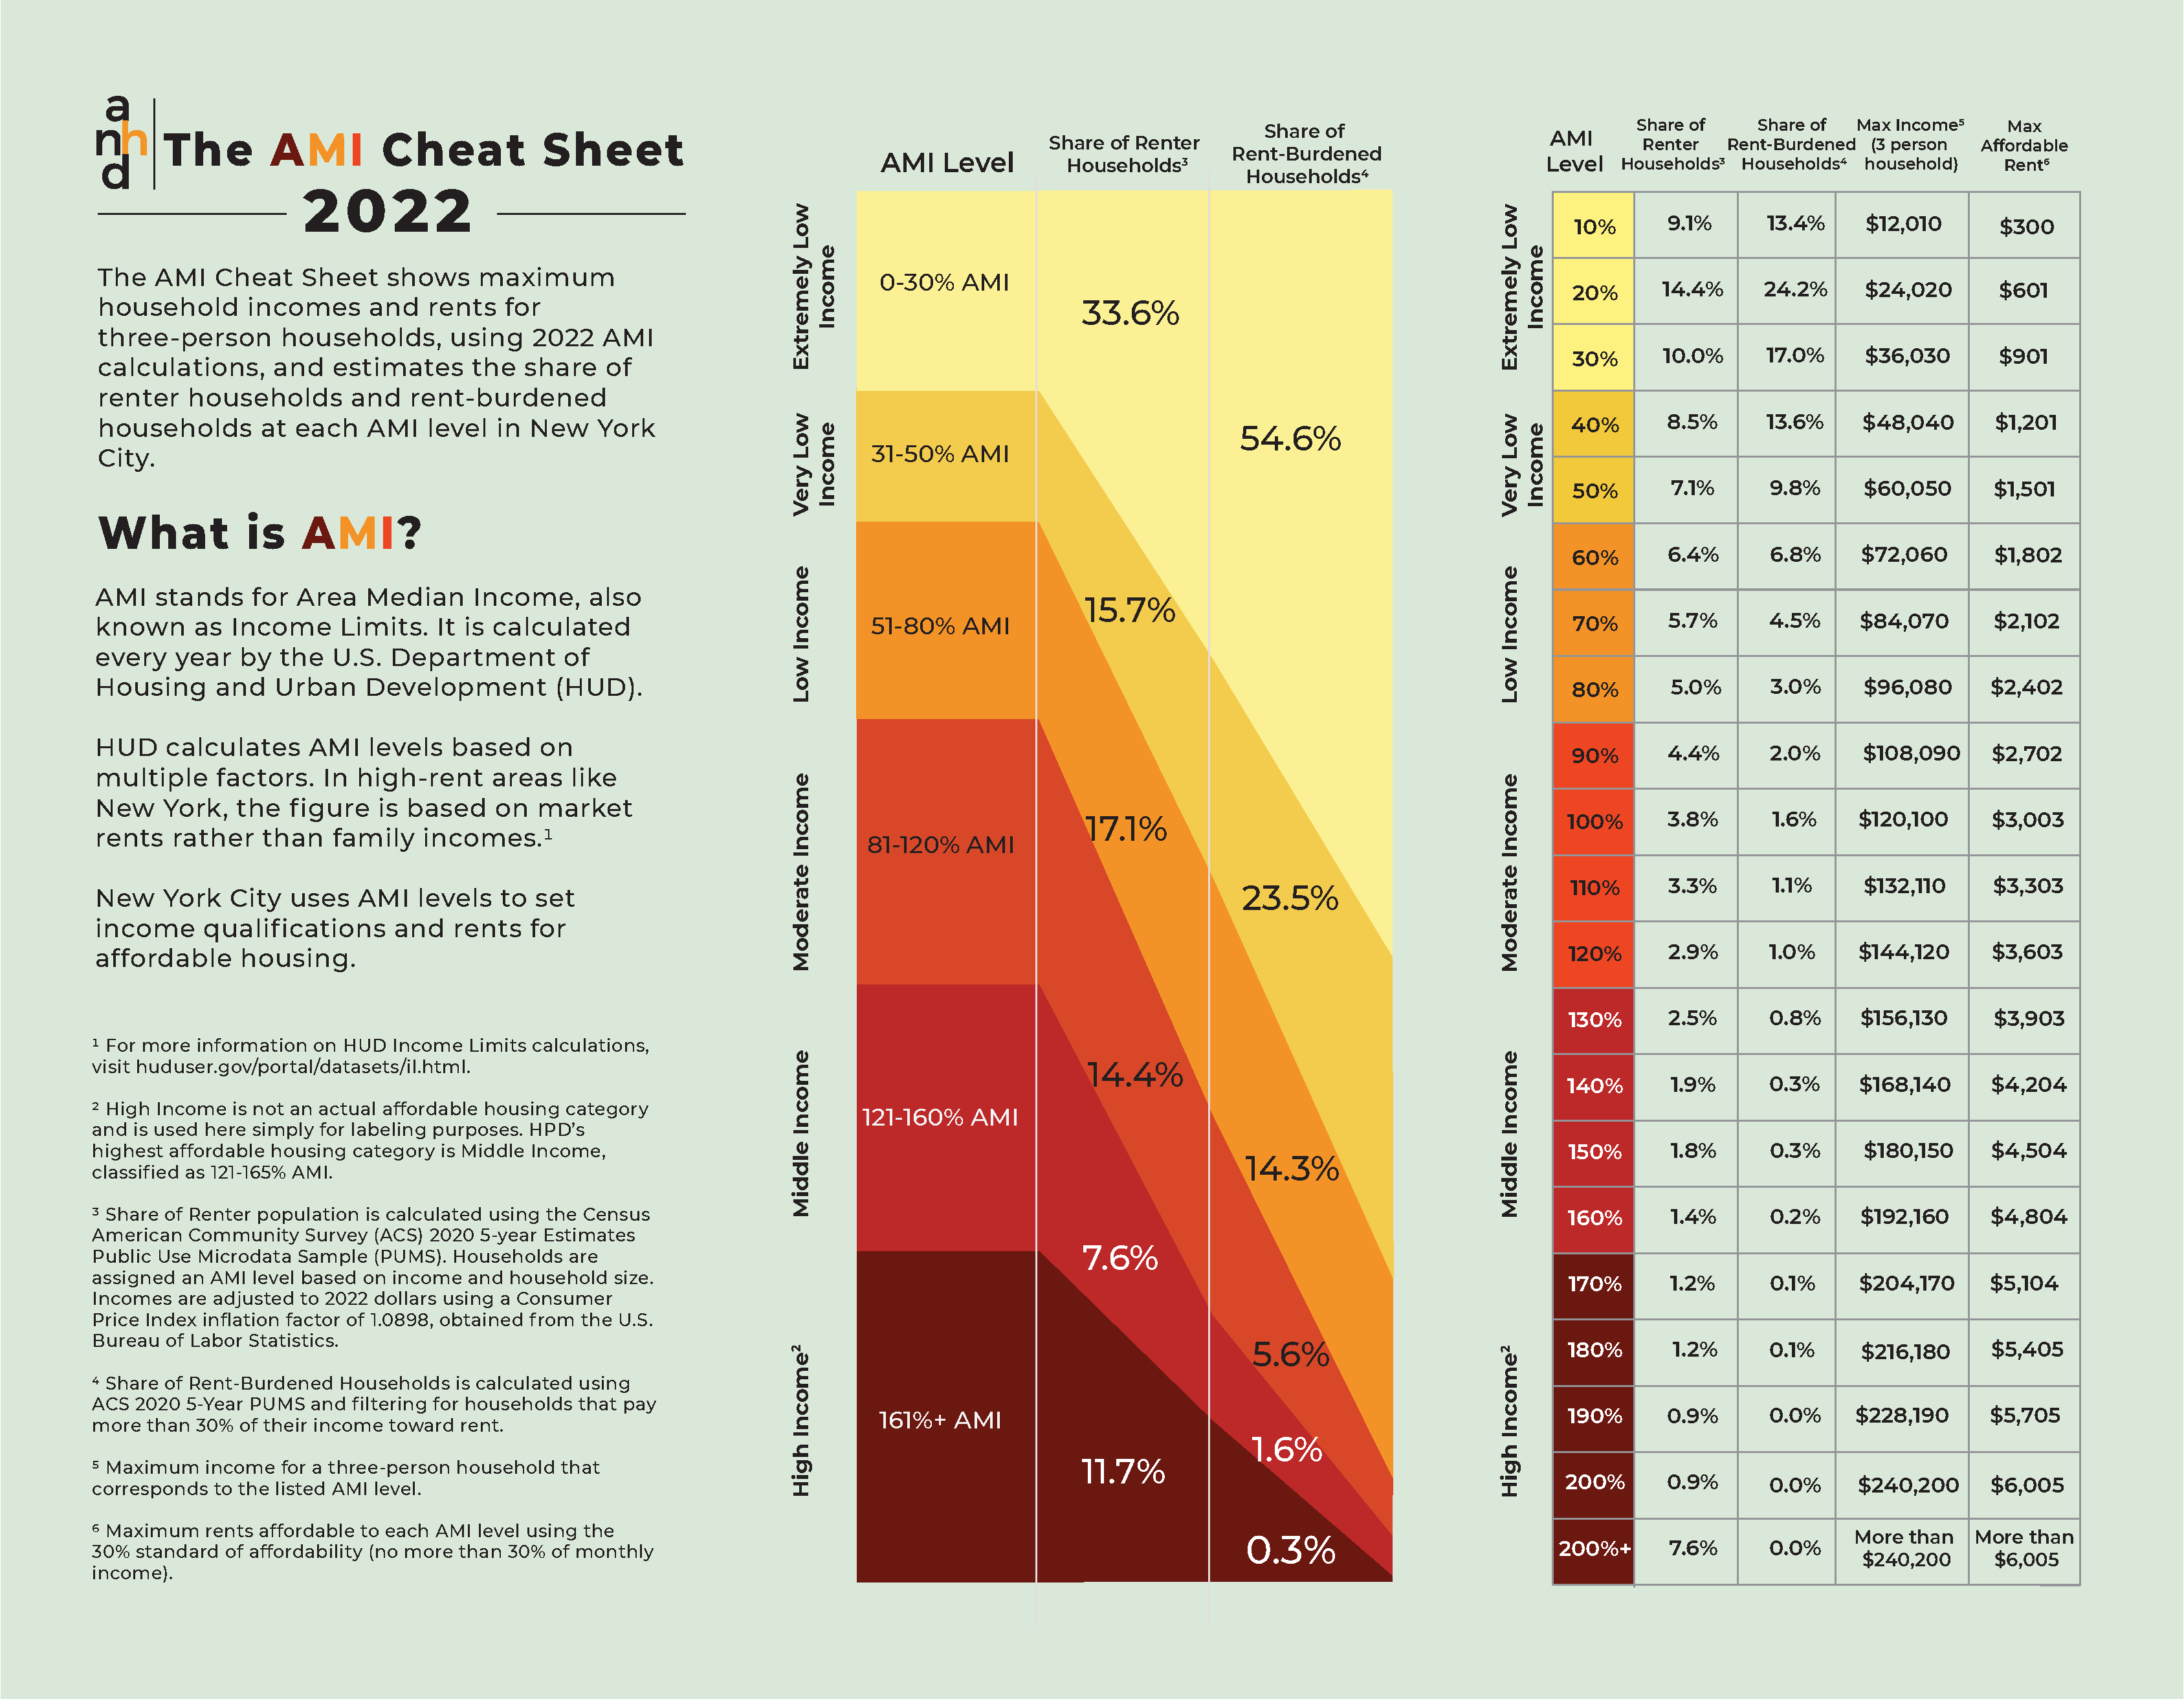
This year’s AMI Cheat Sheet reveals dramatic disparities. About half (49.3%) of New York City renter households fall into Extremely Low Income[1] or Very Low Income[2] AMI categories. However, these households make up 78.1% of the City’s rent burdened population. In other words, almost eight out of ten rent-burdened households make less than 50% AMI.
Nearly 8 in 10 rent-burdened households make less than 50% AMI
Clearly, New York City’s lowest income renters are most in need of affordable housing, being disproportionately rent burdened and vulnerable to displacement. However, our City government has largely built housing at AMI levels that don’t meet the true need. HUD’s convoluted AMI calculation only further masks the disparity between what is considered “affordable housing” and what housing New Yorkers need.
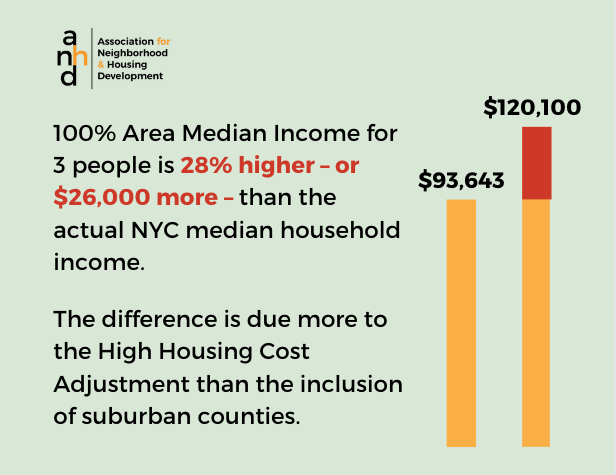
How? The 100% AMI benchmark is tens of thousands of dollars greater than NYC’s real household median income. As a result, what might sound like a low AMI and fairly affordable unit is often entirely out of reach for the low-income households that truly need it. Over the last ten years, AMI has consistently been approximately $20,000 higher than New York City’s actual median income, and sometimes more. In 2022, 100% AMI for a three-person household is $26,457, or 28% greater than New York City’s real household median income. This distortion reflects what New Yorkers have known for many years – what is touted as “affordable” housing is not actually affordable to those who truly need it.
[1] Equivalent to 0-30% AMI or $0-$36,030 per year for a household of three.
[2] Equivalent to 31-50% AMI or $36,031-$60,050 per year for a household of three
Why is AMI so different from real incomes?
A common misconception is that AMI levels are inflated only because HUD includes wealthier suburban counties in its calculation. Rather than just using New York City income data to calculate local AMI, HUD uses data from the “New York, NY Metro Fair Market Rent (FMR) Area,” which also includes Westchester, Rockland, and Putnam Counties. Since these areas generally have higher incomes, they increase the AMI. However, the inclusion of suburban counties is only a small factor in the inflation of New York City’s AMI.
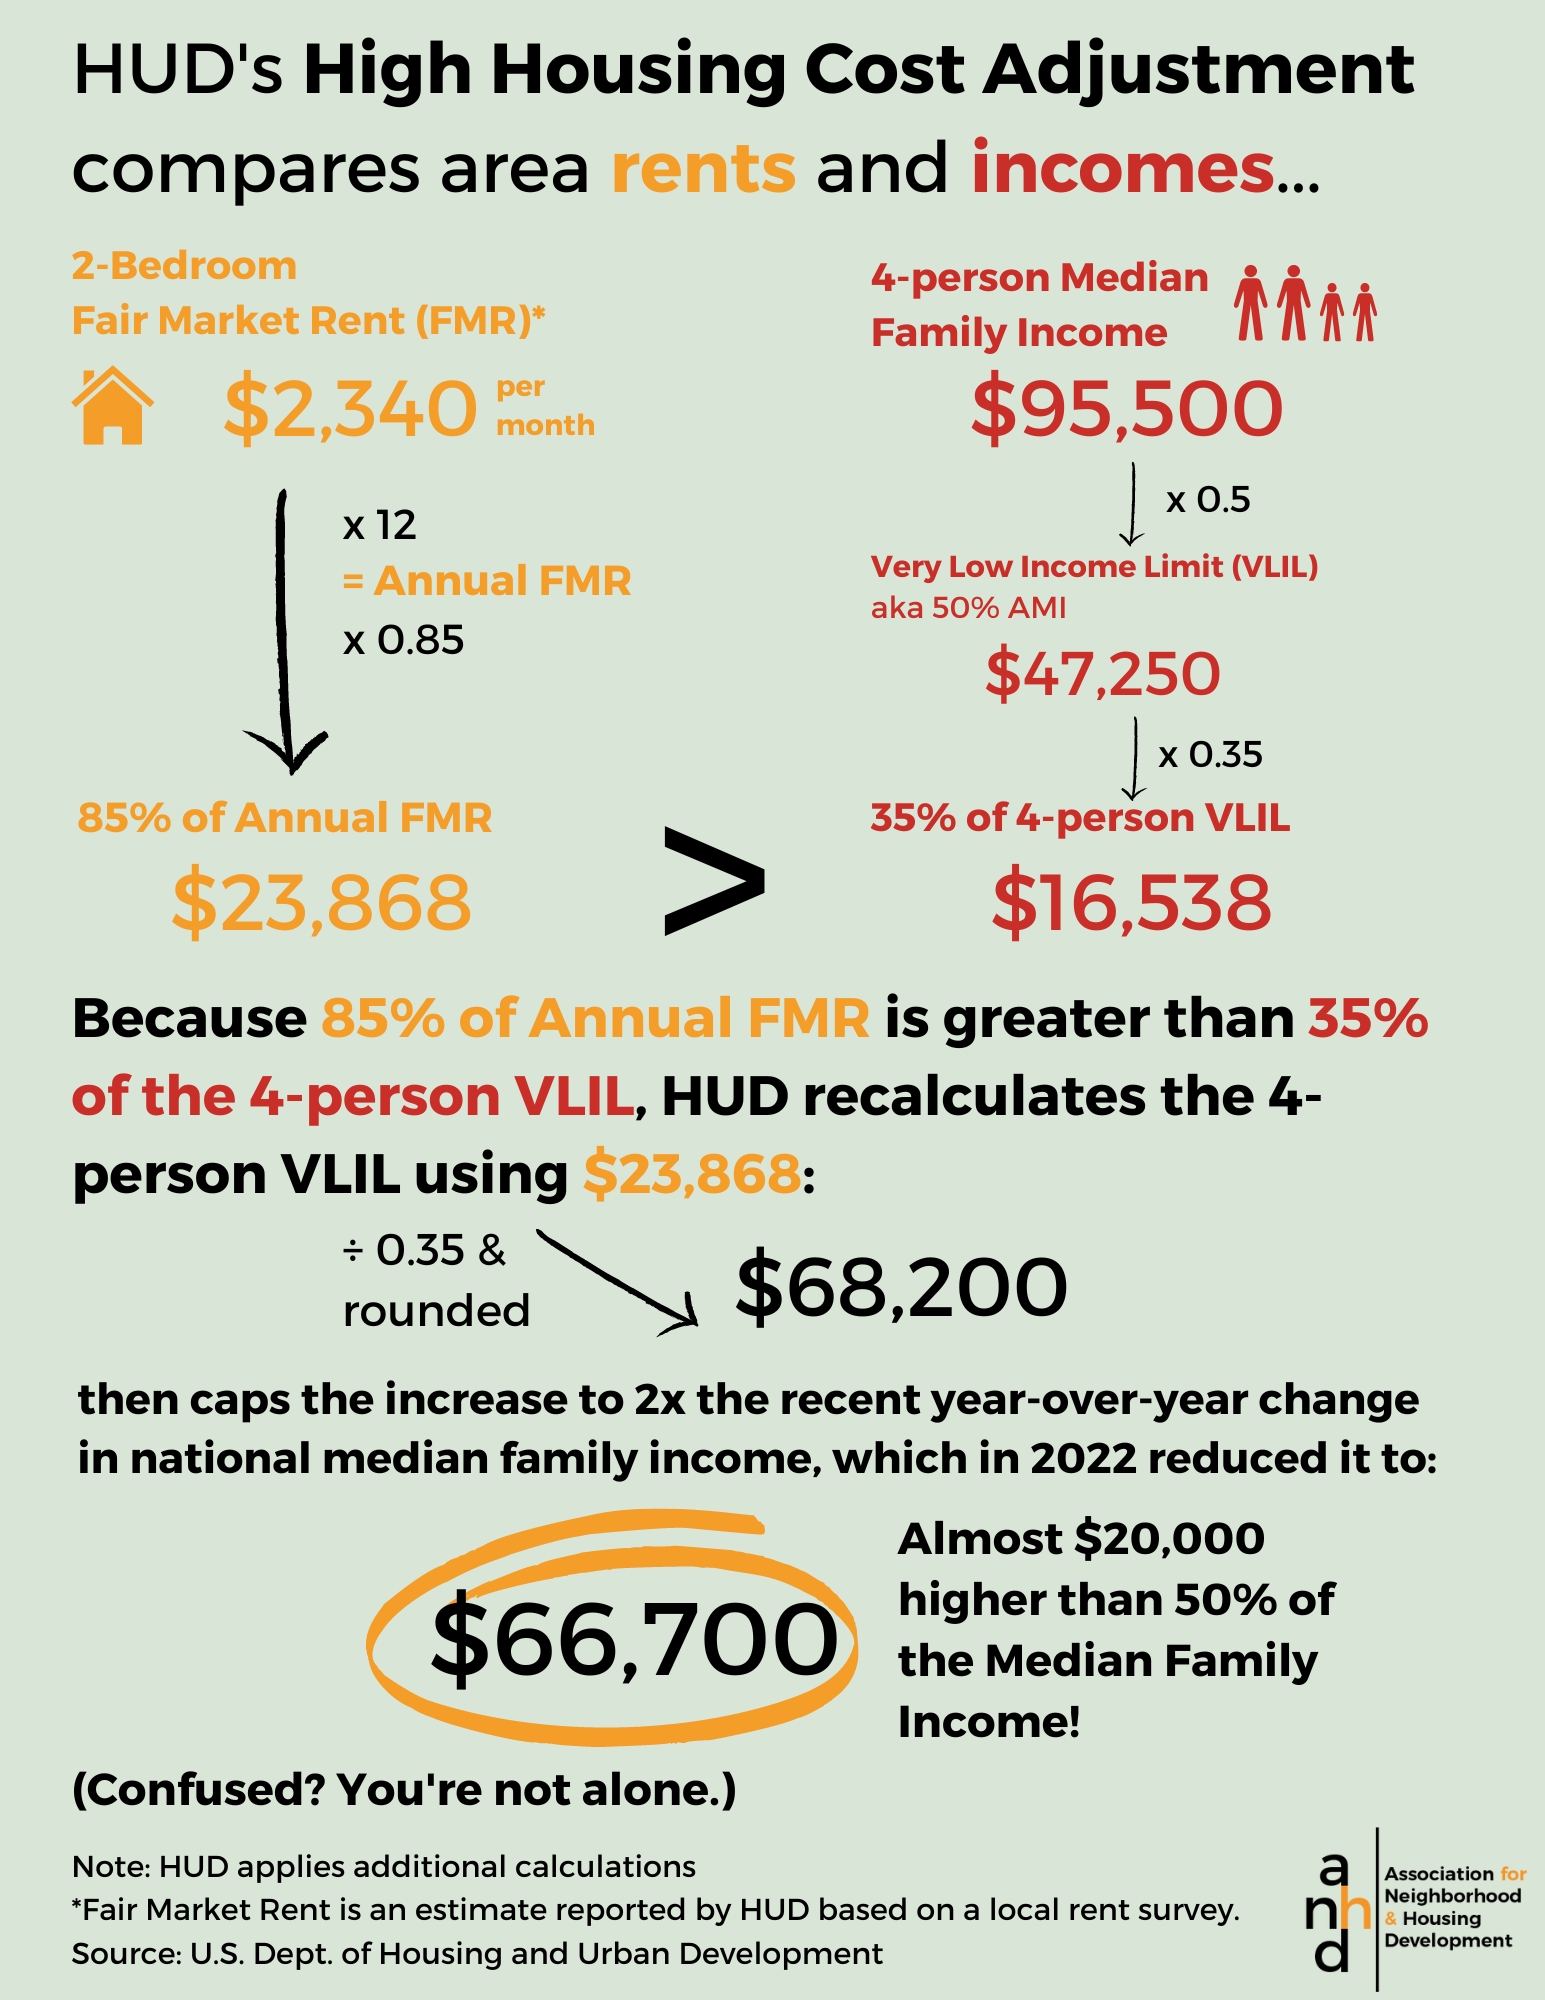
The main culprit is the High Housing Cost Adjustment (HHCA), a convoluted step in HUD’s calculations. The HHCA is specifically designed to increase the income pegged to AMI levels for metro areas where market rents are unusually high compared to incomes. Thus, in high-rent metro areas, AMI is actually not based on incomes at all. It instead reflects the area’s sky-high rental costs. The logic behind the HHCA is that in areas with disproportionately high rental costs, more people will need affordable housing. By raising the incomes that correspond to each AMI level, HHCA makes more people, with higher incomes, qualify for affordable housing. The steps taken to calculate the high housing cost adjustment, outlined below, come from HUD’s Income Limits documentation for the New York, NY HUD Metro Fair Market Rent Area in 2022.
By comparing real household median incomes for New York City and the New York Metro FMR Area to 100% AMI over time, we see that the majority of the difference between AMI levels and actual household median incomes is due to the HHCA, not the inclusion of Westchester, Rockland, and Putnam Counties. This has been true every year of the last decade. The difference between real New York City median household incomes and AMI levels has grown even larger in the last five years, approaching $30,000 difference – in 2013 the difference was $18,407, and in 2022 it was $26,457. This means that over time, AMI is becoming increasingly disconnected from real incomes. Since maximum affordable rents are proportional to AMI, rents for affordable units have also risen faster than what New Yorkers can afford. From 2021 to 2022, AMI (and thus maximum affordable rents) rose 4%, while the NYC median income rose only 1.9%.
What are the implications of this disconnect?
The calculation of AMI would not be a problem if housing development policies produced housing at AMI levels that are affordable to households that are most rent burdened. As the 2022 AMI Cheat Sheet shows, 54.6% of New York City's rent-burdened households make less than 30% AMI, and another 23.5% make below 50%. Yet only 15.4% of affordable housing produced under the de Blasio administration's Housing New York plan targeted housheolds under 30% AMI. The problem is that housing is produced at much higher AMIs and still touted as affordable, when those units do not meet the need.
Often, producing housing at AMI levels that are called Low Income – 51-80% AMI – results in “affordable” units that are actually very close to market rate, though they made up the largest group of “affordable” units produced under Housing New York. An investigation of the affordable housing lottery by The City found that higher AMI units receive the fewest applications and are the hardest to fill. An 80% AMI unit targeted to a three-person household can rent for $2,402, but the most recent Housing Vacancy Survey showed a 12.64% vacancy rate for units asking for more than $2,300 (Table 9) – clearly, those are not the affordable units that New Yorkers really need.
Some developers argue that they can’t afford to simply build more housing for lower incomes. However, because of the increasing mismatch between 100% AMI and real household incomes, developers are getting more revenue for building at the same “affordability” level, even after adjusting for inflation. For example, the maximum affordable rent for a three-person, 60% AMI household has risen $400 real dollars since 2013. The status quo usage of distorted AMI levels is only making “affordable” housing more unaffordable over time.
The disconnect between AMI levels and real incomes is even starker when examined at the neighborhood level. While problematic citywide, New York Metro Area AMI levels are dramatically misaligned with local needs. In 28 out of New York’s 59 community districts, the typical household cannot afford a 60% AMI “Low Income” unit. Meanwhile, only nine districts have a median household income that is greater than or equal to 100% AMI. The disconnect in the Bronx is especially notable: in ten out of twelve community districts, a typical household makes less than 60% AMI and in five out of twelve districts makes less than 30% AMI.
Moving forward
To solve our housing crisis New York City must create housing at affordability levels for the households that truly need it, instead of relying on misleading and oversimplified AMIs. As the 2022 AMI Cheat Sheet shows, 54.6% of rent-burdened households make less than 30% AMI, and another 23.5% make below 50%. While it would be helpful for the Federal government to make the AMI formula more representative of actual incomes, New York City does not need to wait to implement good affordable housing policy. Local government has the power and flexibility to create subsidy programs targeting various different AMI levels. New York City needs to modify its programs and shift its own capital resources to build and preserve housing and lower income levels where it is truly needed.
Notes
- All income data has been adjusted for inflation to 2022 dollars. All changes and differences are in constant 2022 dollars.
- The difference between AMI and actual median incomes vary by household size, but AMI is higher than real incomes for any household size. We used a three-person household in this analysis as an example.