Introduction
Non-profit affordable housing developers have played a key role in New York City housing plans since the beginning of the modern, city-backed affordable housing model. Mayor Koch’s seminal Ten-Year Housing Plan relied heavily on non-profit developers, in part because it was understood that non-profit developers are able to deliver an especially high level of public benefit since they make development decisions independent of an individual bottom-line economic interest.1 Historically, for-profits participated in affordable housing development through joint ventures with non-profits to provide additional resources to projects. As the development landscape changed, subsequent mayors created policies that allowed for-profit developers to take a central role as primary developers and long-term owners of projects. The role of for-profit developers has grown over the years, leaving community development practitioners to question whether affordable housing development has become overly reliant on for-profit developers and whether the level of public benefit created by these projects has diminished, which the Association for Neighborhood and Housing Development (ANHD) has termed the “for-profitization” of affordable housing development.
Many observers expected that Mayor de Blasio’s housing plan would reevaluate this for-profitization trend. However, it has been difficult to analyze the issue as accurate and detailed public data about city-financed housing development has not existed. Now, for the first time, information is available through the recent implementation of New York City Local Law 44, which requires developers to report certain project details. In this white paper, ANHD evaluates the for-profitization of affordable housing and uses Local Law 44 data to compare some aspects of the relative role and the public benefit of non-profit and for-profit developers in Mayor de Blasio’s Housing New York Plan.
Recent History of City-Backed Housing Plans
When Mayor Koch introduced the historic Ten-Year Housing Plan in 1986, he created the modern era of city-backed development with the largest affordable housing plan to-date that relied primarily on municipally-established programs and policies. The original Ten-Year Plan lasted for fifteen years, growing beyond Koch’s original 100,000 unit goal, and continued through the terms of Mayor Dinkins and Mayor Giuliani. Through its life, the plan encompassed a wide range of programs that took advantage of different opportunities to produce and preserve affordable housing. While the essential approach was set by Koch, it was adjusted by the two mayors that followed him.
Non-profit entities were the primary developers under Mayor Koch, and Mayor Dinkins largely continued the Koch-era model of development during his tenure. In 1994, Mayor Giuliani made a significant change to this model by adding a new development program called the Neighborhood Entrepreneurs Program. This program marked a turning point in city housing development policy because it was the first program to encourage for-profit developers to enter the affordable housing market, not as supporting partners with mission-driven developers, but instead as the primary developers and owners of the real estate.
When Mayor Bloomberg came into office, his ambitious 2003-2014 New Housing Marketplace Plan continued the trend of for-profitization established by Giuliani, and further tilted the affordable housing development landscape towards for-profit developers. The continuation of this shift under Mayor Bloomberg was both a result of specific policy changes that favored for-profit developers within the land-allocation and funding-application process, and also the changing landscape of affordable real estate development as city-owned land became less available.
Mayor de Blasio took office in 2014, elected on a public platform that emphasized shifting Mayor Bloomberg’s housing development policies to better maximize the public benefit, and quickly released his Housing New York Plan to create and preserve 200,000 units of affordable housing. The plan included the development of 80,000 newly constructed affordable units and the preservationfinancing of 120,000 existing affordable units. The plan was not only unprecedented in the number of units, but also because the plan promised to make the tools of affordable housing development more effective at creating the greatest public benefit in New York City neighborhoods. With this background, many community development practitioners expected that the de Blasio plan would rebalance the legacy of for-profitization left by the Giuliani and Bloomberg administrations.
What is Local Law 44?
The New York City Council passed Local Law 44 in 2012, requiring the New York City Department of Housing Preservation and Development (HPD) to collect and make information about housing development projects receiving city financial assistance publically available. The Local Law 44 dataset used for this analysis is comprehensive of the first two and a half years of Mayor de Blasio’s term, including 30,498 units of permanent rental affordable housing from 193 closings created between January 1, 2014 and June 30, 2016. Because the analyzed data only captures permanent rental affordable housing, it excludes homeownership and supportive housing projects. The Local Law 44 dataset, although limited in some respects, allows us to better understand the following questions:
- What types of deals has HPD prioritized?
- What types of developers has HPD prioritized?
- Where has subsidy been allocated?
- Where, and at what level, has affordability been developed?
To answer these questions, ANHD first assigned a status of “non-profit developer” or “for-profit developer” to each of the individual deals in the dataset. This status was based on their self-reported listing in the data. In the case of joint-venture developments with a for-profit and non-for-profit partnership, ANHD staff reviewed the publically available ownership and mortgage documents for the individual building to determine whether the beneficial owner and beneficial borrower was a non-profit or a for-profit, and then assigned the project developer status accordingly.
What Does the Data Say About the Role of For-Profit and Non-Profit Developers?
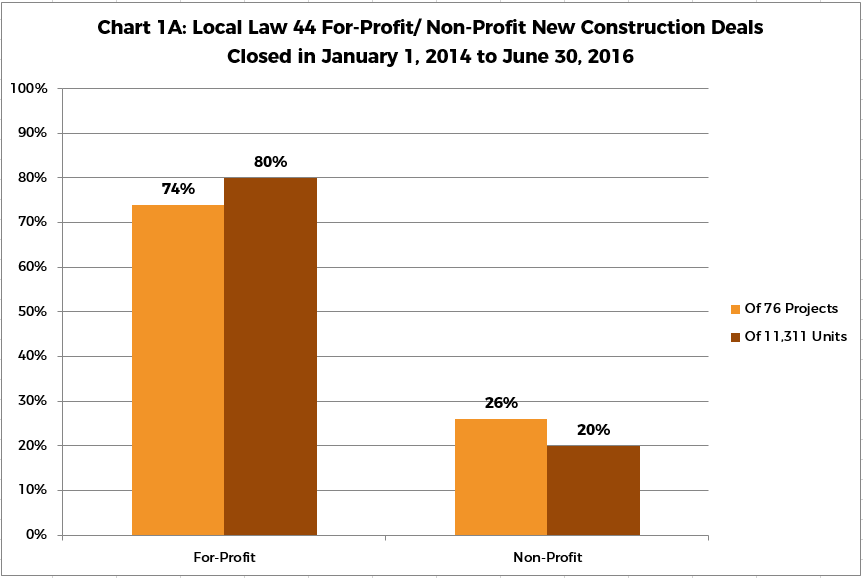
The data shows that for-profit developers were heavily favored for new-construction development. There were 110 for-profit entities and 83 non-profit entities that accounted for the total 193 individual projects, and 30,498 units analyzed by ANHD. For-profit developers accounted for 74% of new-construction deals, while non-profit developers accounted for just 26% of new-construction deals. The discrepancy is even greater for the number of units created. For-profit developers accounted for 80% of the new-construction units, while non-profit developers accounted for 20% of the new-construction units. (Refer to Chart 1A: Local Law 44 For-Profit/ Non-Profit New Construction Deals Closed in January 1, 2014 to June 30, 2016)
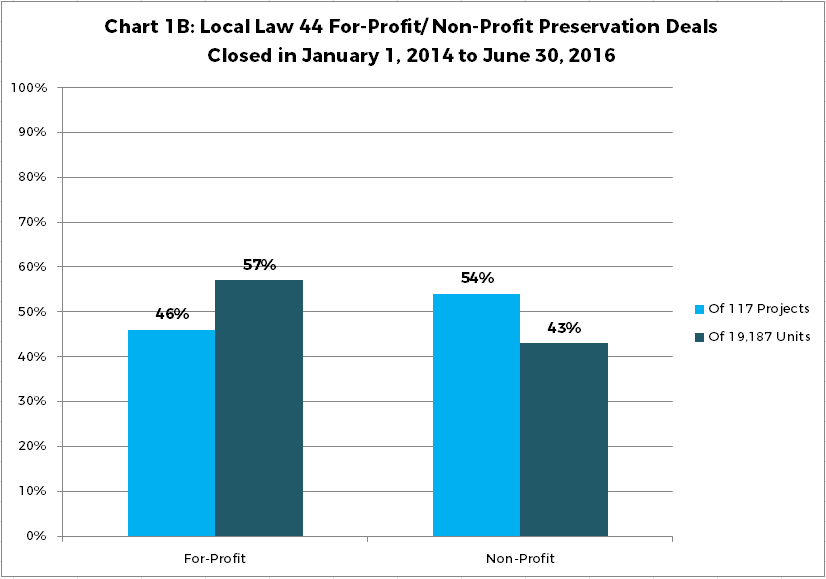
On the preservation side of the plan, the data shows that non-profit developers accounted for 54% of preservation deals, and for-profit developers accounted for 46% of preservation deals. Although, mission-driven developers closed more preservation deals than their for-profit counterparts, the data shows an imbalance between the number of deals closed and the number of units preserved, with for-profits accounting for 57% of the preservation units while non-profit developers accounted for only 43% of preservation units. (Refer to Chart 1B: Local Law 44 For-Profit/ Non-Profit Preservation Deals Closed in January 1, 2014 to June 30, 2016) This means for-profit developers are closing fewer projects, but working on larger-scale projects that yield more units. This discrepancy in the projects’ scale is significant, as discussed below.

For community development practitioners who believe city policies that marginalize non-profit developers also undermine the capacity of the non-profit sector, the question of which developers receive city-backing for new-construction deals is especially important. New-construction deals allow for significantly higher developer fees than preservation deals and are therefore fundamental to creating developer capacity. Developer fees can account for 10-15% of the total development cost of a new-construction deal, but are much lower for preservation deals which have a set cap perunit. New-construction projects and their larger developer fees are a key resource for any developer to deepen staff capacity, attract equity partners, build a strong balance sheet, and create the scale to develop a self-sufficient and diverse housing portfolio. And, as the total development cost of a newconstruction deal increases, the increase in the developer fee can further build developer capacity. The Local Law 44 data suggests that city policies that are leading to the discrepancy in newconstruction deals awarded to for-profit and non-profit developers is having a significant impact on the capacity of the non-profit sector.
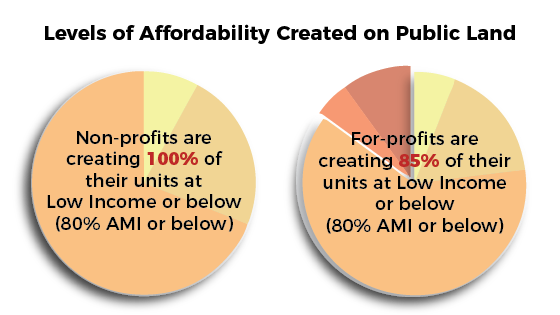
For development on city-owned land, the developer is chosen through a city-managed Request for Proposals (RFP) process. City-owned land developments accounted for one-third of the total affordable housing development activity in New York City. The other two-thirds of development activity consisted of preservation financing of existing affordable units and new-construction opportunities brought to the city by developers. The discrepancy between the percentage of projects on city-owned land awarded to non-profit and for-profit developers is stark: between January 2014 and June 2016, 90% of RFP-selected new-construction projects went to for-profit developers and 10% went to nonprofit developers. While the universe of RFP-projects is modest – there were ten total RFPs that would create affordable rental housing in the time period analyzed here – the difference is notable. (Refer to Chart 2: NYC Request for Proposal Awards January 2014 to June 2016)
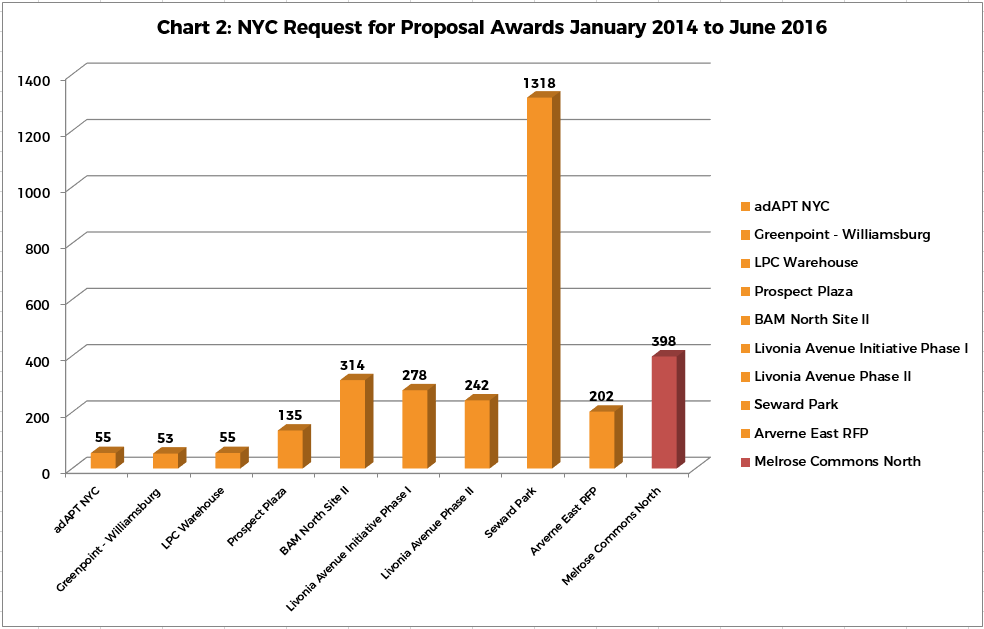
Development projects awarded on city-owned land are the clearest indicator of the intent of city policy because that is where the city has direct control over all phases of the process. Through the RFP process, the city not only chooses the developer, it lays out the general guidelines for both the public benefit that the housing must provide, as well as the general cost parameters. Over the past several decades, as public land available for housing development has become scarcer, the remaining sites have taken on an even higher importance for the public benefit of New York City.

*BAM North Site was provided “other city assistance” in the form of acquisition price.
What Does the Data Say About the Public Benefit Created By Each Developer Type?
Depth of Housing Affordability:
The Local Law 44 data shows the difference in the level of affordability created by for-profit and non-profit developers. HPD collects the unit data by listing out units under each income category including:
- Extremely Low Income (ELI): 0-30% of Area Median Income (AMI)
- Very Low-Income (VLI): 31-50% of AMI
- Low-Income (LI): 51-80% of AMI
- Moderate-Income (Mod): 81-120% of AMI
- Middle-Income (Mid): 121-165% of AMI
Although all developers are required to report this data on all of their units, AMI reporting in the Local Law 44 dataset was not enforced. Therefore, the Local Law 44 AMI data from January 1, 2014 to June 30, 2016 was limited. ANHD analyzed projects that reported 100% of their project affordability, which accounts for 40% of the total dataset. While this lack of full data is frustrating, the existing data is considered sufficient to be statistically significant. The problem of lack of reporting has become worse in more recent Local Law 44 data releases, including the July 1, 2016 to December 31, 2016 data, which has such low levels of unit-affordability reporting that ANHD was not able to include the data in this analysis.
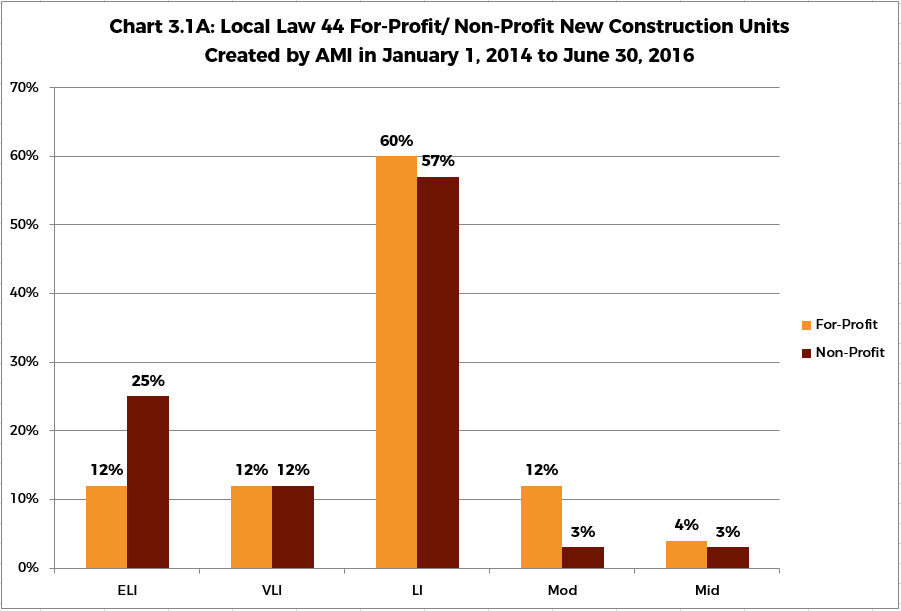
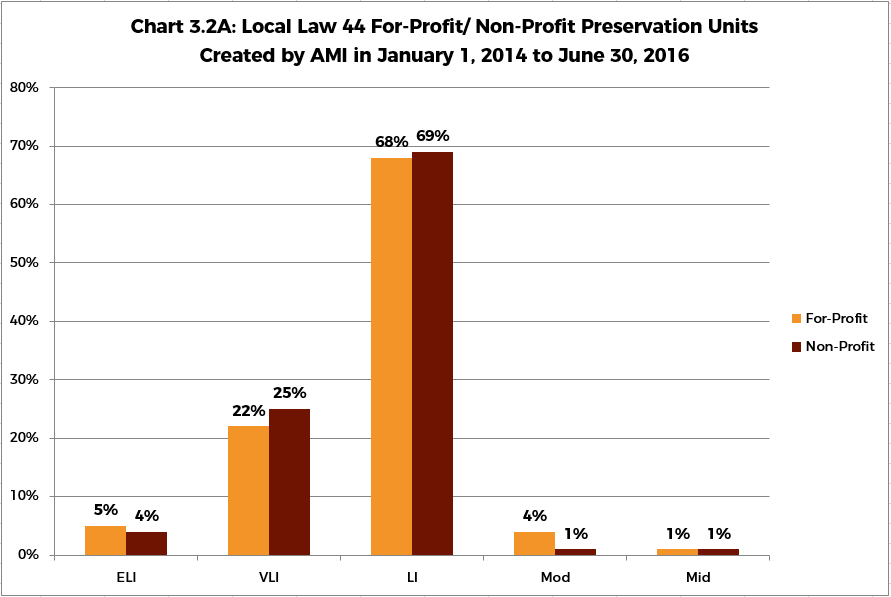
The January 1, 2014 to June 30, 2016 data shows that non-profit developers built 25% of the total number of new-construction ELI units, compared to 12% built by for-profits. In contrast, for-profits built 16% of the new-construction moderate- and middle-income units, compared to only 5% built by mission-driven developers. (Refers to Chart 3.1A: Local Law 44 For-Profit/ Non-Profit New Construction Units Created by AMI in January 1, 2014 to June 30, 2016 & Chart 3.2A: Local Law 44 For-Profit/ Non-Profit Preservation Units Created by AMI in January 1, 2014 to June 30, 2016)

†Subset of Local Law 44 2017 June (2013 and later) dataset
‡79 projects of 193 projects reporting AMI Breakdown for 100% of units in each project
The unit-level data for city-awarded RFP’s also shows a difference between for-profit and non-profit unit affordability levels. In the RFPs awarded to a non-profit, a total of 398 units were developed, and 100% of those units were developed for ELI, VLI, and LI households. For-profits developed a total of 2,652 units and 85% of the units were for ELI, VLI, and LI households.
Source: NYC Housing Preservation & Development. Local Law 44 2017 June (2013 and later)
†Subset of Local Law 44 2017 June (2013 and later) dataset
‡79 projects of 193 projects reporting AMI Breakdown for 100% of units in each project
The discrepancy in the level of affordability created by mission-driven developers and for-profit developers in new-construction deals is important because it suggests that there is a difference in the intent of the developer; although for-profits and non-profits are looking at the same RFP requirements and have access to the same subsidy programs, non-profits are making decisions within the development process to build at deeper levels of affordability. As a result, in the 10 RFP deals in the local law 44 dataset, non-profits developed low-income units at a rate of 15 percentage points higher than for-profits. This illustrates the general fact that non-profits rent to the floor of the AMI band requirements, while for-profits rent to the ceiling of the AMI requirement in affordable housing projects.
Permanent Affordability:
Local Law 44 does not provide specific data about the length of the affordability benefit in each project, but the issue is a key public policy question and one factor in understanding whether there is a difference in the public benefit created by for-profit and no n-profit developers.
In general, city-backed affordable housing is only affordable for the term of the financing. Up until recently, this term was most commonly 30 years.5 What has become known as the “expiring use crisis,” first became apparent in federally-backed Section 8 ho using developments and state-backed Mitchell-Lama housing developments. Over the past decade, as these projects reached the time when the develo per could opt-out of continuing the affordability requirements, local neighborhoods have lost tens of thousands of affordable units that have transitioned to market-rate after the initial affordability term expired. There is a similar crisis already o ccurring in city-backed affordable housing, as the housing built under Mayor Koch begins to reach the end of the 30-year affordability requirement.
While the existing data is limited, it is generally the case that for-profit developers have a bottom-line incentive to opt-out of the affordability if and when they can, and if and when the market-rate rents in the neighborhood where the housing is located is greater than the rents that would be allowed by an affordable housing regulatory restriction. In contrast, non-profit developers generally chose to renew the affordability terms, preserving the value of the development for the community and the taxpayer.
The below chart shows the number of city-backed affordable housing units that will have their affordability restrictions expire beginning in 2017, illustrating the scale of the coming expiring-use crisis that will most likely occur in for-profit developed buildings. The Lo cal Law 44 data demonstrates that this trend has continued under Mayor de Blasio.
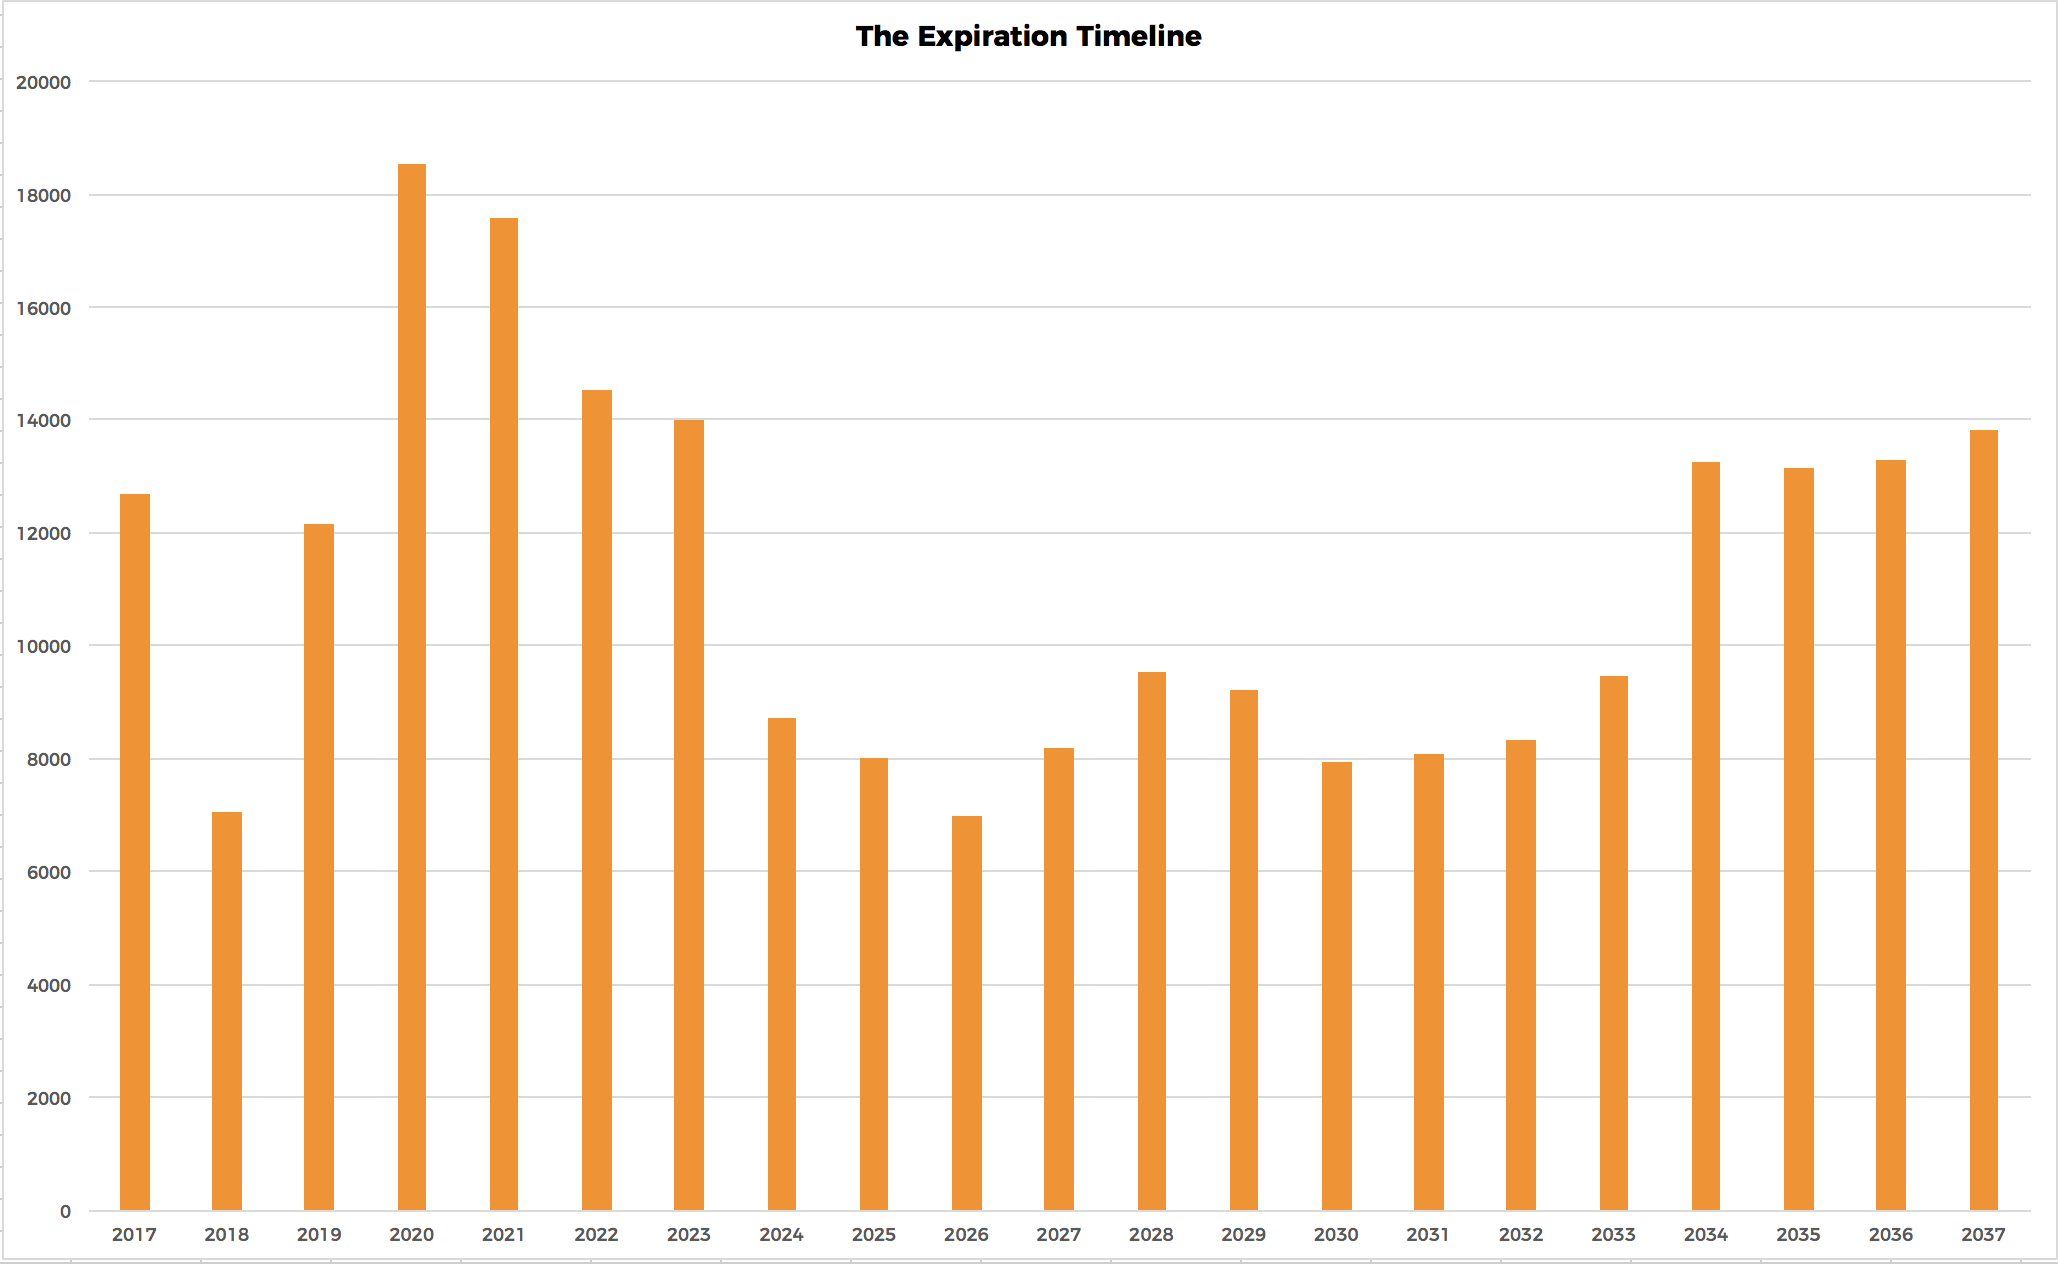
Source: The Association for Neighborhood & Housing Development (ANHD). Permanent Problem Requires a Permanent Solution: New York City’s Next Affordable Housing Expiring-Use Crisis and the Need for Permanent Affordability. 2010. P. 28.
What Does the Data Say About Who Gets City Subsidy?
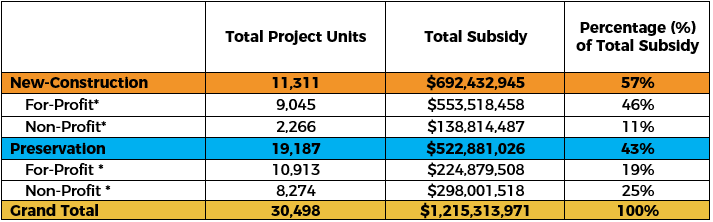
HPD has given a total of $1.2 billion in city subsidy to permanent rental affordable housing projects from January 2014 to June 2016.6 There is an imbalance of the total amount of city subsidy allocated to each category of developer, with for-profit developers receiving 65% of the total subsidy allocated between January 2014 and June 2016.
Of total subsidy amount, $692 million went to new-construction deals with 80% allocated to forprofits and 20% allocated to non-profit developers. Preservation projects received a total of $523 million in subsidy with non-profit developers receiving 57% of the total preservation subsidy and for-profit developers receiving 43% of the preservation subsidy.
Source: NYC Housing Preservation & Development. Local Law 44 2017 June (2013 and later).
Source: NYC Housing Preservation & Development. Local Law 44 2017 June (2013 and later).
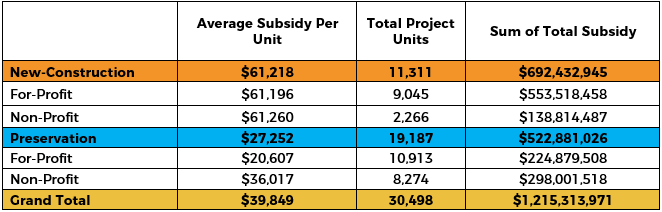
The Local Law 44 data provides an important opportunity to review and compare the actual per-unit costs, and to evaluate the factors that may influence this cost. Community development practitioners have believed that, for a variety of reasons, non-profit developers often have a higher per-unit development cost, and this fact has been used to argue that non-profit developers are less efficient users of public subsidy. Local Law 44 gives the data to evaluate this question for the first time.
The data shows that there is a difference in subsidy per-unit between for-profit and mission-driven developers, although less than community development practitioners anticipated. For-profits average $61,196 per-unit for new-construction and $20,607 per-unit for preservation, while mission-driven developers average $61,260 per unit for new-construction and $36,017 per unit for rehabilitation.
Local Law 44 data about the depth of affordability, the project scale, and the complexity of tenant relations in preservation deals gives a fuller context for understanding the discrepancy in subsidy perunit:
- Scale: Efficiency of scale has an impact on overhead and operating costs, as they are shared among projects with greater number of units. The size of the project has an impact on what subsidies can be unlocked to finance a project. A project with more units will typically cost less per-unit because units allow for more cross subsidizing among units. Also, more money can be raised through the use of Low Income Housing Tax Credits (LIHTC), city subsidized bond deals and HPD subsidy. A project with fewer units will have more limited opportunities to cross subsidize units along with a more limited pool of city subsidy. The smaller scale of the average non-profit deal is therefore a factor in the cost per-unit.
- Depth of affordability: The depth of affordability had an impact on efficiency because deeper levels of affordability in a project are more expensive upfront. These low-income units produce a lower rent roll, making it more complex to cover upfront and operating costs throughout the term of the project. High-income and market-rate units tend to generate enough income to cover operating costs through the term of the project. The deeper-level of affordability created by the non-profit developers is therefore a factor in the cost per-unit.
- Complexity of Tenant Relations in Preservation Deals: Preservation deals in general, and smaller deals and cluster-site deals in particular, require a high-level of hands-on, staff-intensive engagement to support tenants who are in-place or relocated during the construction phase of the project. Relocation and tenant-in-place deals often become more costly, as the organization is required to help subsidize the rents and/or any relocation costs of the tenants. The fact that mission- driven developers are doing a larger share of the preservation deals, and a larger share of the smaller scale and cluster-site preservation deals with small unit counts, is therefore a factor in the cost per-unit.
Data Summary
The newly available Local Law 44 data provides an essential window to understanding the “forprofitization” of affordable housing development. In summary:
- 74% of new-construction deals were by for-profit developers, while non-profit developers accounted for just 26% of new-construction deals. For-profit developers produced 80% of the new-construction units, while non-profit developers produced 20% of the new-construction units.
- Non-profit developers accounted for 54% of preservation deals, and for-profit developers accounted for 46% of preservation deals. Despite closing more deals, mission-driven developers produced 43% of the preservation deals, creating a discrepancy between the scale of projects between for-profit and non-profit developers.
- Between January 2014 and June 2016, 9 out of 10 RFP-selected new-construction projects went to for-profit developers. Of those deals, non-profits developed low-income units at a rate of 15 percentage points higher than for-profits, with non-profits developing 100% of their units for low-income households.
- From January 1, 2014 to June 30, 2016, non-profits built 94% of the total number of newconstruction ELI, VLI, LI units, compared to 84% built by for-profits.
- For-profits built 16% of the new-construction moderate- and middle-income units, compared to 5% built by non-profit developers.
- 80% of the new construction subsidy was allocated to for-profits and 20% allocated to nonprofit developers.
- 57% of the total preservation subsidy went to non-profits and for-profit developers receiving 43% of the preservation subsidy.