Introduction
This year’s report comes at an especially important moment in history – this is the 40-year anniversary of the CRA’s passing, and the 10-year anniversary of the 2008 financial crisis, which was a direct result of irresponsible behavior by financial institutions that targeted and misled poor and minority communities with expensive and unsustainable loans.
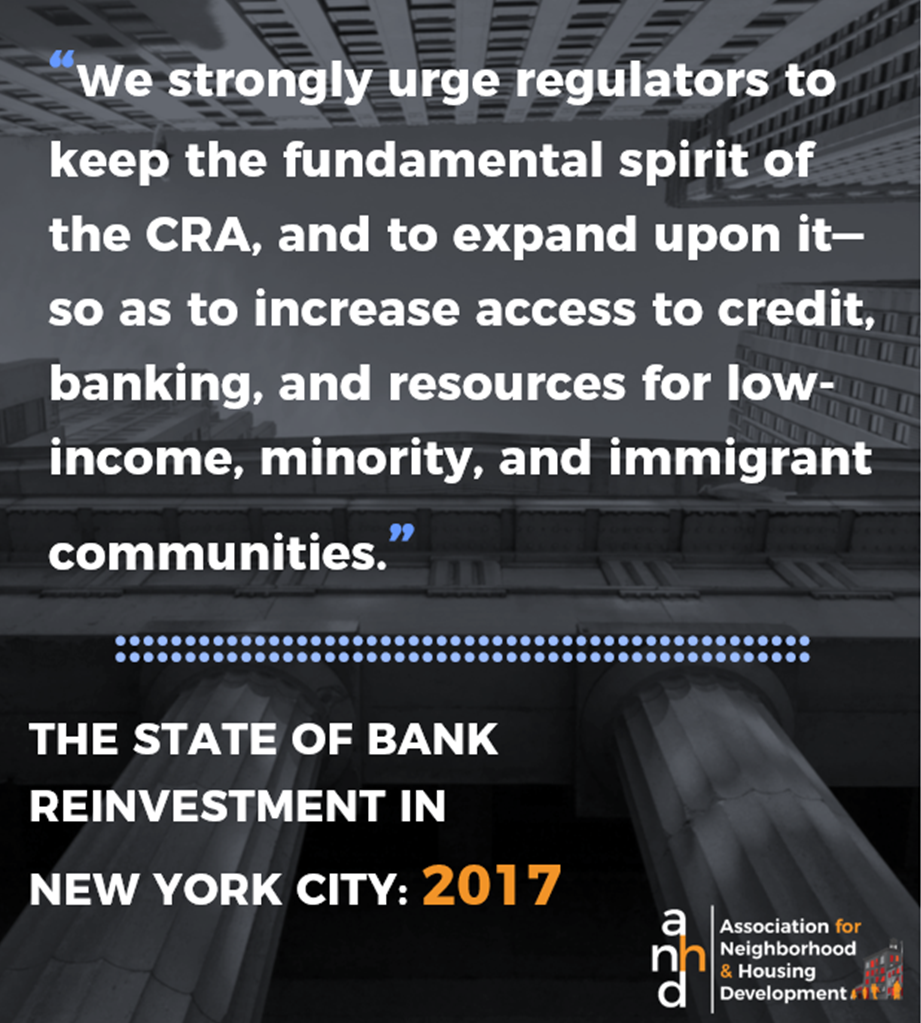
The 25 banks in this study reinvested over $13 billion in NYC neighborhoods in 2016. While we know there are many areas where the CRA can be updated and improved upon, it is still one of the most important laws we have to hold banks accountable to reinvesting in our local communities and we fear that new reforms proposed by bank regulators could come at the expense of the intentional focus on low- and moderate-income communities. We strongly urge the regulators to keep the fundamental spirit of the CRA and to expand upon it, so as to increase access to credit, banking, and resources for low-income, minority, and immigrant communities.
This report analyzes the CRA activity from calendar year 2016 for 25 banks that operate in New York City, including some of the largest banks in the country.
Key Findings
Deposits and the Reinvestment Quantity & Quality Indexes: Local deposits continue to increase; they are up 14% from 2015-16 as compared to 8.3% from 2014-15, reaching $1.2 trillion. Reinvestment dollars reached $13.1B, up from $11 B in 2016. Eleven banks reinvested over 5% of their local deposits, up from nine in 2014, but four banks increased deposits and decreased reinvestment dollars. Seven banks had a quality score over “3”.
Branches and Bank Products: Overall branches are down by 18, but only down by one in lower-income tracts. The distribution of branches remains inequitable, with core Manhattan inundated, while lower-income neighborhoods still lack sufficient branches and ATMs. The Bronx is still the most unbanked area in the City. While many banks accept New York City’s municipal identification card, IDNYC, as secondary identification, no bank in this study currently accepts the IDNYC as primary identification
In terms of multifamily lending, we note a sharp decline in lending among the banks in this study (down 20%), but not as sharply in lower-income neighborhoods (down 9.4%, above 2014 levels) and the multifamily market still appears strong. While signs of physical and financial distress remain low, we know from experience that not all buildings where harassment and displacement occur will appear on distressed lists. If a landlord successfully displaces tenants, the building may never fall into distress. Banks and non-bank lenders continue lending to known bad actor landlords. Banks should lend responsibly by not underwriting loans that fuel displacement and working closely with tenants and tenant organizers
For 1-4 family lending, the number of home purchase loans among banks in this study was relatively stable from 2015-16, but still below 2013 levels. The rise of non-bank independent mortgage company lenders continues, particularly in refinance loans and FHA lending. These institutions are not covered by the CRA. Racial disparities persist. 22% of New Yorkers are Black and 29% Hispanic, yet on average the banks in this study made just 6.8% of home purchase loans to Blacks and 7.1% to Hispanics.
Community Development Staff, Community Development Lending, and CRA-Qualified Investments: The amount loaned for community development increased by 28% and the volume by 17%. CRA-qualified investment dollars decreased by 18%, while the number of investments increased 15%. The volume to nonprofits is substantial in some cases, but the volume of community development lending to neighborhood-based CDCs in particular remains low overall.
Economic Development and Small Business Lending: Community development loans and investments that fall under the economic development category increased greatly in 2016. The number of small business loans decreased 4% overall and remained flat in low- to moderate-income tracts; the amount loaned increased in both categories. The dollar amount of community development loans for economic development increased 35%, but investments and grants decreased. We are pleased to see banks engage with nonprofit developers and the City to use and support the City’s new Industrial Developer Fund to create and maintain affordable manufacturing space
CRA-eligible Philanthropic Grants: CRA-eligible grants increased in 2016. After a number of years of declining dollars, grants were up 3.7% by volume and 8.1% by dollar in 2016. The distribution of grant dollars remains unequal in some cases, resulting in larger grants to fewer organizations, particularly in some of the larger banks. Grant-making to neighborhood-based organizations increased 23% by volume and 3.6% by dollar amount in 2016. At five of the largest banks and almost all of the smaller banks, over a third of grants were to neighborhood-based organizations; three of the largest banks and six of the smaller gave over a third to neighborhood-based organizations by dollar amount
Charts

 Click here to download a copy of the report. Or, if you would like to receive a physical copy of the report (availability pending), please contact Development Director Lauren Nye.