Introduction
In this new white paper analyzing trends in 1-4 family home lending in New York City, the Association for Neighborhood & Housing Development (ANHD) uses newly released Home Mortgage Disclosure Act (HMDA) data from 2016 to update a paper we published in 2016 based on trends in the 2012-2014 HMDA data.
We found that non-bank lenders are taking over an increasing portion of lending on 1-4 family homes, particularly to borrowers of color and low- and moderate-income (LMI) borrowers. Lenders in HMDA are categorized as banks, credit unions, and non-bank lenders, which are mortgage companies that do not take deposits from customers or businesses. We define non-bank lenders as non-depository lenders that are not owned by or affiliated with a bank or credit union.
Key Findings
In 2016, 30% of all home purchase loans were originated by non-bank lenders, up from 23% in 2012. The percentage of non-bank lenders was 50% for refinance loans in 2016, up from 23% in 2012.
Non-bank lenders made 30% of home purchase loans to LMI borrowers and 58% of refinance loans to LMI borrowers. They also accounted for 31% of home purchase loans and 61% of refinance loans in LMI neighborhoods.
25% of home purchase loans to White borrowers were made by non-bank lenders versus 59% and 50% of the loans to Black and Hispanic borrows, respectively. Similar disparities appear for refinance loans.
Much of the disparities to LMI borrowers and borrowers of color relates to the higher concentration of Federal Housing Administration (FHA) loans to these populations and the decline in FHA lending by the largest banks. There certainly remain questions about qualified borrowers possibly being steered to FHA loans, which are more expensive than conventional loans. But, the overall concern this trend raises is that non-bank lenders are far less regulated than their bank-chartered peers, nor are they covered by the Community Reinvestment Act (CRA). In the run up to the 2007 economic crisis, the majority of dangerous sub-prime loans were made by non-bank lenders chasing relatively high rates of return for their investors and basing their businesses on relatively costly sources of capital.
The data does not suggest that the growing role of non-bank lenders is having a negative impact at the moment because most lending is still made within the appropriate Qualified Mortgage and Ability To Repay standards that were established in post-crisis reforms. However, recent economic history has shown that unregulated non-bank lenders – which depend on non-depository sources of capital – will always be motivated to find a loophole in the regulations, which allow for short-term gain with unwise loans in exchange for potential long-term damage to the communities in which the loans were made. In this climate of deregulation, we are concerned this could come back.
Other Findings
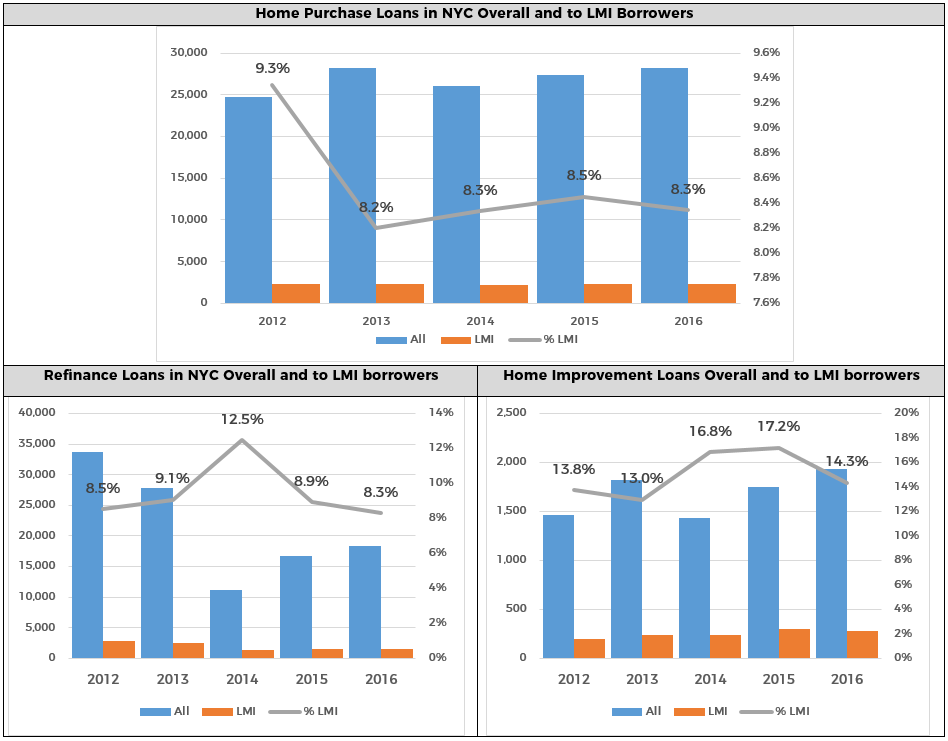
Home purchase loans citywide increased in 2016. From 2014 to 2016, home purchase lending increased by 8.6% (up 4.8% in 2015, then another 3.1% in 2016). Unlike the decline in the prior three years (2012 to 2014), lending to lower-and moderate-income (LMI) borrowers also increased from 2014 to 2016. Lending increased 6.3% in 2015 and then another 1.8% in 2016, exceeding 2012 levels slightly. In 2012, 9.3% of all home purchase loans went to LMI borrowers, but that dropped to just over 8% each year from 2013 to 2016.
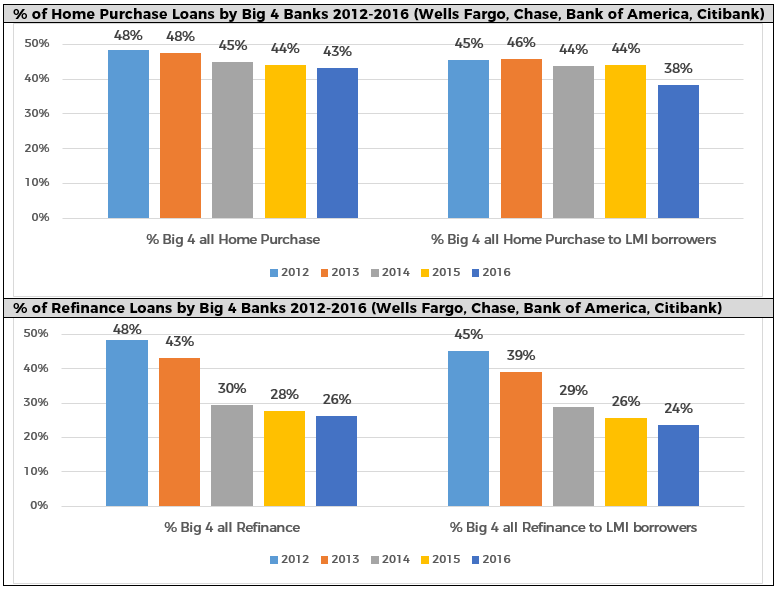
The share of lending by the “Big 4” banks (Chase, Citibank, Bank of America and Wells Fargo) in New York City has been steadily declining, from 48% of home purchase loans in 2012 to 43% in 2016. Their share of HMDA-reportable refinance loans went from 48% in 2012 down to 26% in 2016. Their share of home purchase loans to lower-income borrowers dropped off even more, from 45% to 38% from 2012 to 2016. The share of refinance loans to LMI borrowers largely mirrored the overall trend.
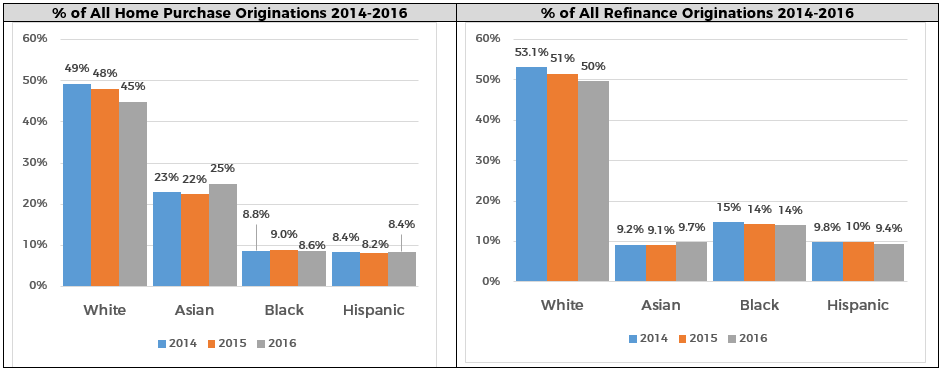
Racial disparities persist. 22% of New Yorkers are Black and 29% are Latino, yet in 2016, only 8.6% of home purchase loans went to non-Hispanic Black Borrowers and 8.4% to Hispanic borrowers of any race. The percentage to Black borrowers actually declined from 2014 to 2015. Similar disparities appear in the percentage of applications and denial rates.
Addressing these disparities will require a concerted effort on the part of government, banks, and bank regulators. This involves increasing the inventory of affordable homes to purchase, making credit available equitably and responsibly, increasing financial assistance, and increasing access to homeownership and financial counseling. It also means holding banks accountable for irresponsible practices that lock lower-income borrowers and people of color out of the housing market. The City and financial institutions, especially those covered by the CRA, have an obligation to ensure that this opportunity of homeownership is made equitably to lower-income and minority people and communities throughout the city.
Home Prices Rise, Lending Increases
Nationwide, and citywide, home prices have been steadily increasing since mid-2011 and are approaching pre-recession levels, which is concerning given how inflated some of the home prices were before the market crashed. While this may be a sign of an improving market, it also puts homeownership further out of reach for lower-income New Yorkers.
Each month, the Federal Reserve Bank of New York reports on home prices as compared to the previous year. Each year since at least 2012, the prices of homes throughout New York City were found to be higher than they were the previous year. As of December 2016, home prices in Queens were 9.2% higher than the year prior. In Brooklyn, that percentage increase was 4.8% and in the Bronx it was 3.1%.1 According to one industry publication, the average sales price of coops and condos in Manhattan was over $2.05 million in 2016, up 12% from the previous year and up 52% from the prior decade. The median sales price was $1.1 million, up 8.9% from the year before and up 28% from 2007.
 At the same time, mortgage interest rates have been relatively low for many years, hovering between 3.5% and 4.5% for the past four years. This combination of increased equity and low interest rates likely contributed to the refinance boom nationwide in 2012, but they dropped off sharply in 2013 and continued to decline into 2014, only starting to come back again in 2015 and 2016.
From 2014 to 2016, home purchase lending increased nationwide. In New York City, it increased by 8.6% (up 4.8% in 2015, then another 3.1% in 2016).3 Unlike the decline in the prior three years (2012 to 2014), lending to lower-and moderate-income (LMI) borrowers also increased from 2014 to 2016. Lending increased 6.3% in 2015 and then another 1.8% in 2016, exceeding 2012 levels slightly. In 2012, 9.3% of all home purchase loans went to LMI borrowers, but that dropped to 8.2%, 8.5% each year from 2013 to 2016.
Given the high cost of entry to homeownership in New York City, and the displacement pressure on lower-income homeowners in many neighborhoods, refinance and home improvement loans can provide critical sources of capital for lower-income borrowers to remain in their homes. HMDA-reportable refinance loans increased over 26% from 2011 to 2012, and then declined 67% from 2012 to 2014 (down 52% to lower-income borrowers). Refinance lending has been increasing steadily since then, but it is not yet near 2012 levels overall and to LMI borrowers in particular.
Home improvement loans followed similar trends, peaking in 2013, dropping in 2014, and rising since then. The number of loans in 2016 exceeded 2012 levels. We also recognize that HMDA does not capture the totality of home improvement loans, but it is the only public data we have and it is important for banks to offer this product to allow homeowners to maintain their homes over the long term.
Trend Continues: Banks Pull Back and Non-Bank Lenders Step In
1-4 family home purchase lending continues to be dominated by large banks, but independent, non-bank lenders are increasing their presence in many areas. This is concerning since independent mortgage companies and credit unions are not covered by the CRA. In most cases, credit unions have a much smaller share of the home loans originated than banks and non-bank lenders. They do make up a larger percentage of home improvement loans. However, given the role of nonbank, non-CRA lenders leading up to the financial crisis and their lack of regulation, we are most concerned with the independent mortgage companies. In 2016, 30% of all home purchase loans were originated by non-bank lenders, up from 27% in 2014 and 22% in 2012. The percentage of non-CRA covered lenders hit 50% for refinance loans, up from 42% in 2014 and 23% in 2012. In fact, online lender Quicken Loans originated the most refinance loans in the city in 2014, 2015, and 2016. The percentage of non-bank lenders making home loans to LMI borrowers mostly matched the trends of all loans. But, the percentage of loans by non-bank lenders to LMI borrowers and borrowers of color exceeds citywide trends.
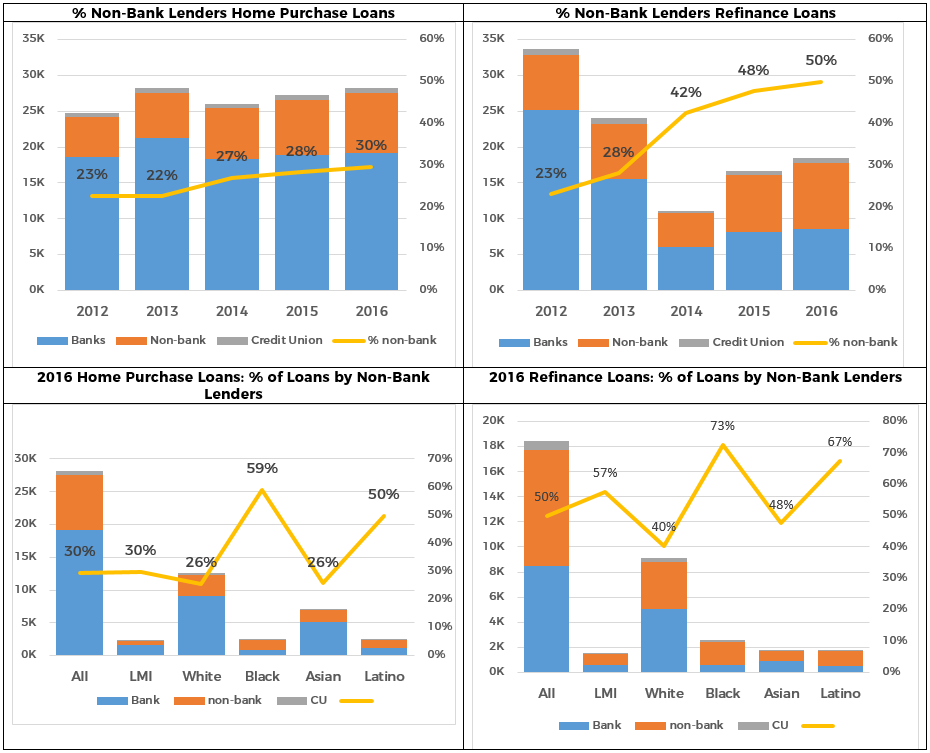
Non-bank lenders made 30% of home purchase loans to LMI borrowers and 58% of refinance loans to LMI borrowers. They also accounted for 31% of home purchase loans and 61% of refinance loans in LMI neighborhoods. Also, 25% of home purchase loans to White borrowers were made by non-bank lenders versus 59% and 50% of the loans to Black and Hispanic borrows, respectively. Similar disparities appear for refinance loans where non-banks comprised 40% of the loans to White borrowers and 73% and 67% of loans to Black and Hispanic borrows, respectively.
Much of the disparities to LMI borrowers and borrowers of color relates to the higher concentration of Federal Housing Administration (FHA) loans to these populations and the decline in FHA lending by the largest banks. There certainly remain questions about qualified borrowers possibly being steered to FHA loans, which are more expensive than conventional loans. But, the overall concern this trend raises is that non-bank lenders are far less regulated than their bank-chartered peers, nor are they covered by the Community Reinvestment Act (CRA). In the run up to the 2007 economic crisis, the majority of dangerous sub-prime loans were made by non-bank lenders chasing relatively high rates of return for their investors and basing their businesses on relatively costly sources of capital. The data does not suggest that the growing role of non-bank lenders is having a negative impact at the moment because most lending is still made within the appropriate Qualified Mortgage and Ability To Repay standards that were established in post-crisis reforms. However, recent economic history has shown that unregulated non-bank lenders will always be motivated to find a loophole in the regulations, which allow for short-term gain with unwise loans in exchange for potential long-term damage to the communities in which the loans were made. In this climate of deregulation, we are concerned this could come back.
The percentages of non-bank lenders making home improvement loans is much lower than purchase and refinance loans, but those are also increasing. 24.4% of home improvement loans in 2016 were made by non-bank lenders, up from 17% in 2015 and 16.1% in 2014.
Big 4 Banks Share of Lending is Declining
The share of lending from the “Big 4” banks (JPMorgan Chase, Citibank, Bank of America and Wells Fargo) has continued to decline in New York City and nationwide. The Federal Reserve Bank recently reported on the share of the top three banks (Wells Fargo, Bank of America and JPMorgan Chase) and found that their share of lending to LMI borrowers nationwide has declined sharply from 2010 to 2016. “These three banks —Wells Fargo, Bank of America and JPMorgan Chase – together originated about 9 percent of all mortgages reported in the 2016 HMDA data and account for nearly one-third of all deposits in the United States… The LMI share among these three banks declined 17 percentage points, from 32 percent in 2010 to 15 percent in 2016.”
Collectively, the “Big 4” banks accounted for 43% of all home purchase loans in the city in 2016, down from 48% in 2012 and 45% in 2014. They dropped from 48% to 30% of refinance loans in that same period. Their share of loans to LMI borrowers has declined even further, from 45% of home purchase loans in 2012 down to 38% in 2016 and from 45% of refinance loans in 2012 down to 24% in 2016.
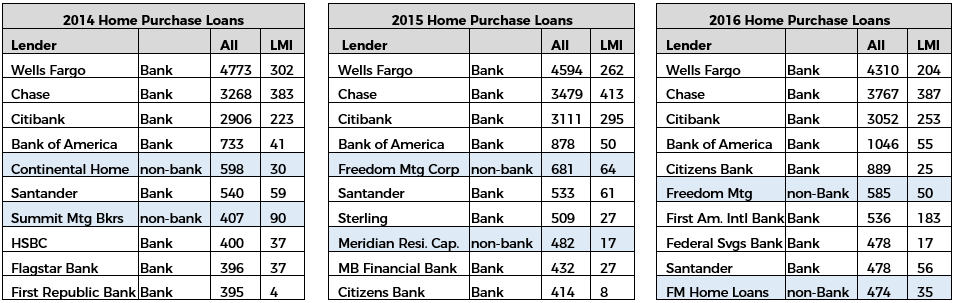
While Wells Fargo has only 21 full service branches in New York City, they have additional mortgage offices and a very large presence in the mortgage market, but that presence is declining. Wells Fargo made 15.3% of all home purchase loans in the city and 8.7% of all loans to LMI borrowers in 2016, a sharp drop from 2012 where they made over a quarter of all home purchase loans and 19% of loans to LMI borrowers. Chase has a much larger branch presence than any other bank in the city. In 2016, they made 13.4% of all home purchase loans and 16.5% of loans to LMI borrowers. That is down from 14.6% of all loans and 20% of loans to LMI borrowers in 2013.
In the past, ANHD has noted that some of the smaller banks may face challenges in competing with the larger national and regional banks, especially those that may not have significant enough branch and office presence or budgets. While that may be the case, we also must say that as large banks pull out and non-banks move in, clearly there is an opportunity to lend and we think banks are best suited do that. While not all banks have the same business model, home lending has long been a main area of business for many banks. Under the CRA, they have an obligation to lend and lend equitably. Thus, the number of bank lenders pulling out of 1-4 family lending is concerning. Dime discontinued its 1-4 family lending in 2015; BankUnited announced the same in 2016; and New York Community Bank did the same in 2017. Apple Bank, Flushing Bank and Signature Bank already make a very low volume, as they concentrate lending in other areas. Sterling Bank will also be discontinuing all but their “CRA lending” (loans to LMI borrowers and in LMI tracts). While not every bank will engage in every area of the CRA, this contributes to the trend of fewer CRAcovered bank lenders in the market.
At the same time, we note that while these banks are pulling out, other banks are growing their presence. First American International Bank, for example, is now in the top 10 home purchase lenders with 536 loans; Citizens Bank entered in 2015 and is now the fifth largest lender with 889 home purchase loans.
Racial Disparities Persist
Racial disparities persist in home lending. 22% of New Yorkers are Black and 29% are Hispanic, yet in 2016, only 8.6% of home purchase loans in New York City went to non-Hispanic Black Borrowers and 8.4% to Hispanic borrowers of any race.7 The percentage to Black borrowers is lower than prior years, while lending to Hispanic borrowers of any race has been fairly steady.
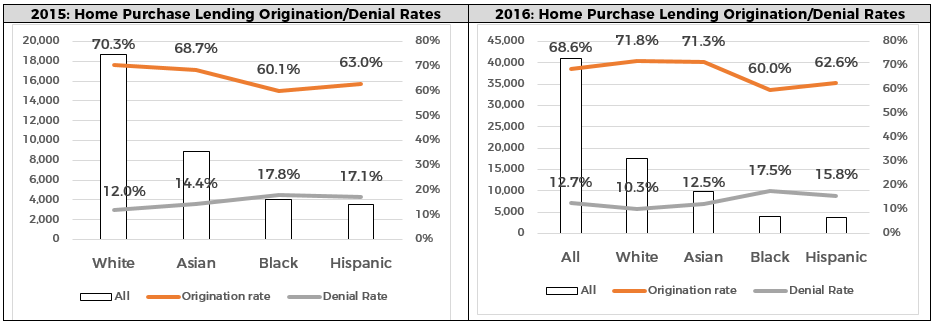
We do note slight improvements in denial rates, but in both areas, Black and Hispanic borrowers lag behind their White and Asian counterparts. And, as noted in the 2016 ANHD HMDA white paper, their percentage of applications also continues to lag, with Black and Hispanic borrowers each making up fewer than 10% of applications.
What Will It Take
Addressing these disparities will require a concerted effort on the part of government, banks, and bank regulators. This involves increasing the inventory of affordable homes to purchase, making credit available equitably and responsibly, increasing financial assistance, and increasing access to homeownership and financial counseling. Given the high cost of housing and the increased displacement pressure on lower-income and senior homeowners, it also involves increasing access to credit to maintain homes for people to stay in; 2-4 family homes are often also sources of affordable housing. It also means holding banks and non-banks accountable for irresponsible practices that lock lower-income borrowers and people of color out of the housing market.
Recommendations
Increase home purchase lending, particularly to lower-income people and neighborhoods, immigrants, and borrowers of color.
Expand the CRA to better reflect the way mortgages are made today.
- Expand the CRA to include non-bank lenders.
- Require banks to include affiliate lenders on their CRA exam.
- Expand assessment areas based on where banks lend, in addition to where they have branches. This is especially important for online lenders and banks that comprise a significant percentage of loans within a geographical region.
Create products and dedicate staff specifically for lower-income borrowers, immigrants, and borrowers of color with low down-payment requirements, reasonable credit assessments that allow for alternative forms of credit, down payment assistance, and connections to homebuyer counseling. Affirmatively market these products to targeted communities and organizations serving those communities.
- Join and actively participate in nonprofit community-based organizations that assist current and potential homeowners. Two such organizations are the New York Mortgage Coalition and Neighborhood Housing Services. These organizations train HUD-certified home counselors and work closely with the banks and clients to help homebuyers through the process. They are also a way for lenders to learn about new challenges and opportunities to better reach potential low- and moderate-income homebuyers.
- Have dedicated loan officers, underwriters, and loan processors who are fully knowledgeable about their products and are able to make approval decisions in a timely manner. These staff should be responsive and available to housing counselors. Loan officers should be visible in the community so that potential homebuyers can speak to them directly. Banks should also increase grants to these organizations to help defray the costs of this essential service.
- Offer reasonable down payment requirements with financial assistance. In a high-cost city like New York City, 20% down payment can be impossible for many borrowers and is not as good a predictor of successful mortgage payment as prepurchase counseling and income. That being said, co-ops are a common affordable option and they often require a 10%-20% down payment, making financial assistance even more important. Financial assistance towards closing costs, down payment, and/or lowering interest rates can come in the form of savings incentives and grants and should have the ability to be layered with other government programs. Banks should also offer a portfolio product that enables them to waive private mortgage insurance (PMI) for down payments below 20%. Banks should ensure products extend to co-ops, including limited equity co-ops, another common source of affordable homeownership.
- Have reasonable credit scores and income requirements that are achievable and related to the ability to repay the loan. Banks should also consider alternative forms of credit, particularly for immigrants who may not have previous loans or credit cards, but have other ways of demonstrating credit-worthiness, such as on-time payment of bills and rent over many years.
- Require homebuyer counseling. Any first-time homebuyer assistance should require pre-purchase counseling and connect potential homebuyers to a qualified provider.
Banks should offer affordable home improvement loans and participate in government programs to assist lower-income homeowners, such as the City’s Home Improvement Program (HIP) offered through New York City Housing Preservation and Development (HPD). With the combination of an aging housing stock, rising home prices, and low wages, it is as important to help people stay in their homes as it is to purchase new homes.
Prevent and responsibly deal with foreclosed homes. Grant more trial and permanent modifications, maintain in good condition homes taken by foreclosure, and reduce the delays for homeowners due to lost paperwork, staff changes, and untimely responses.