Introduction
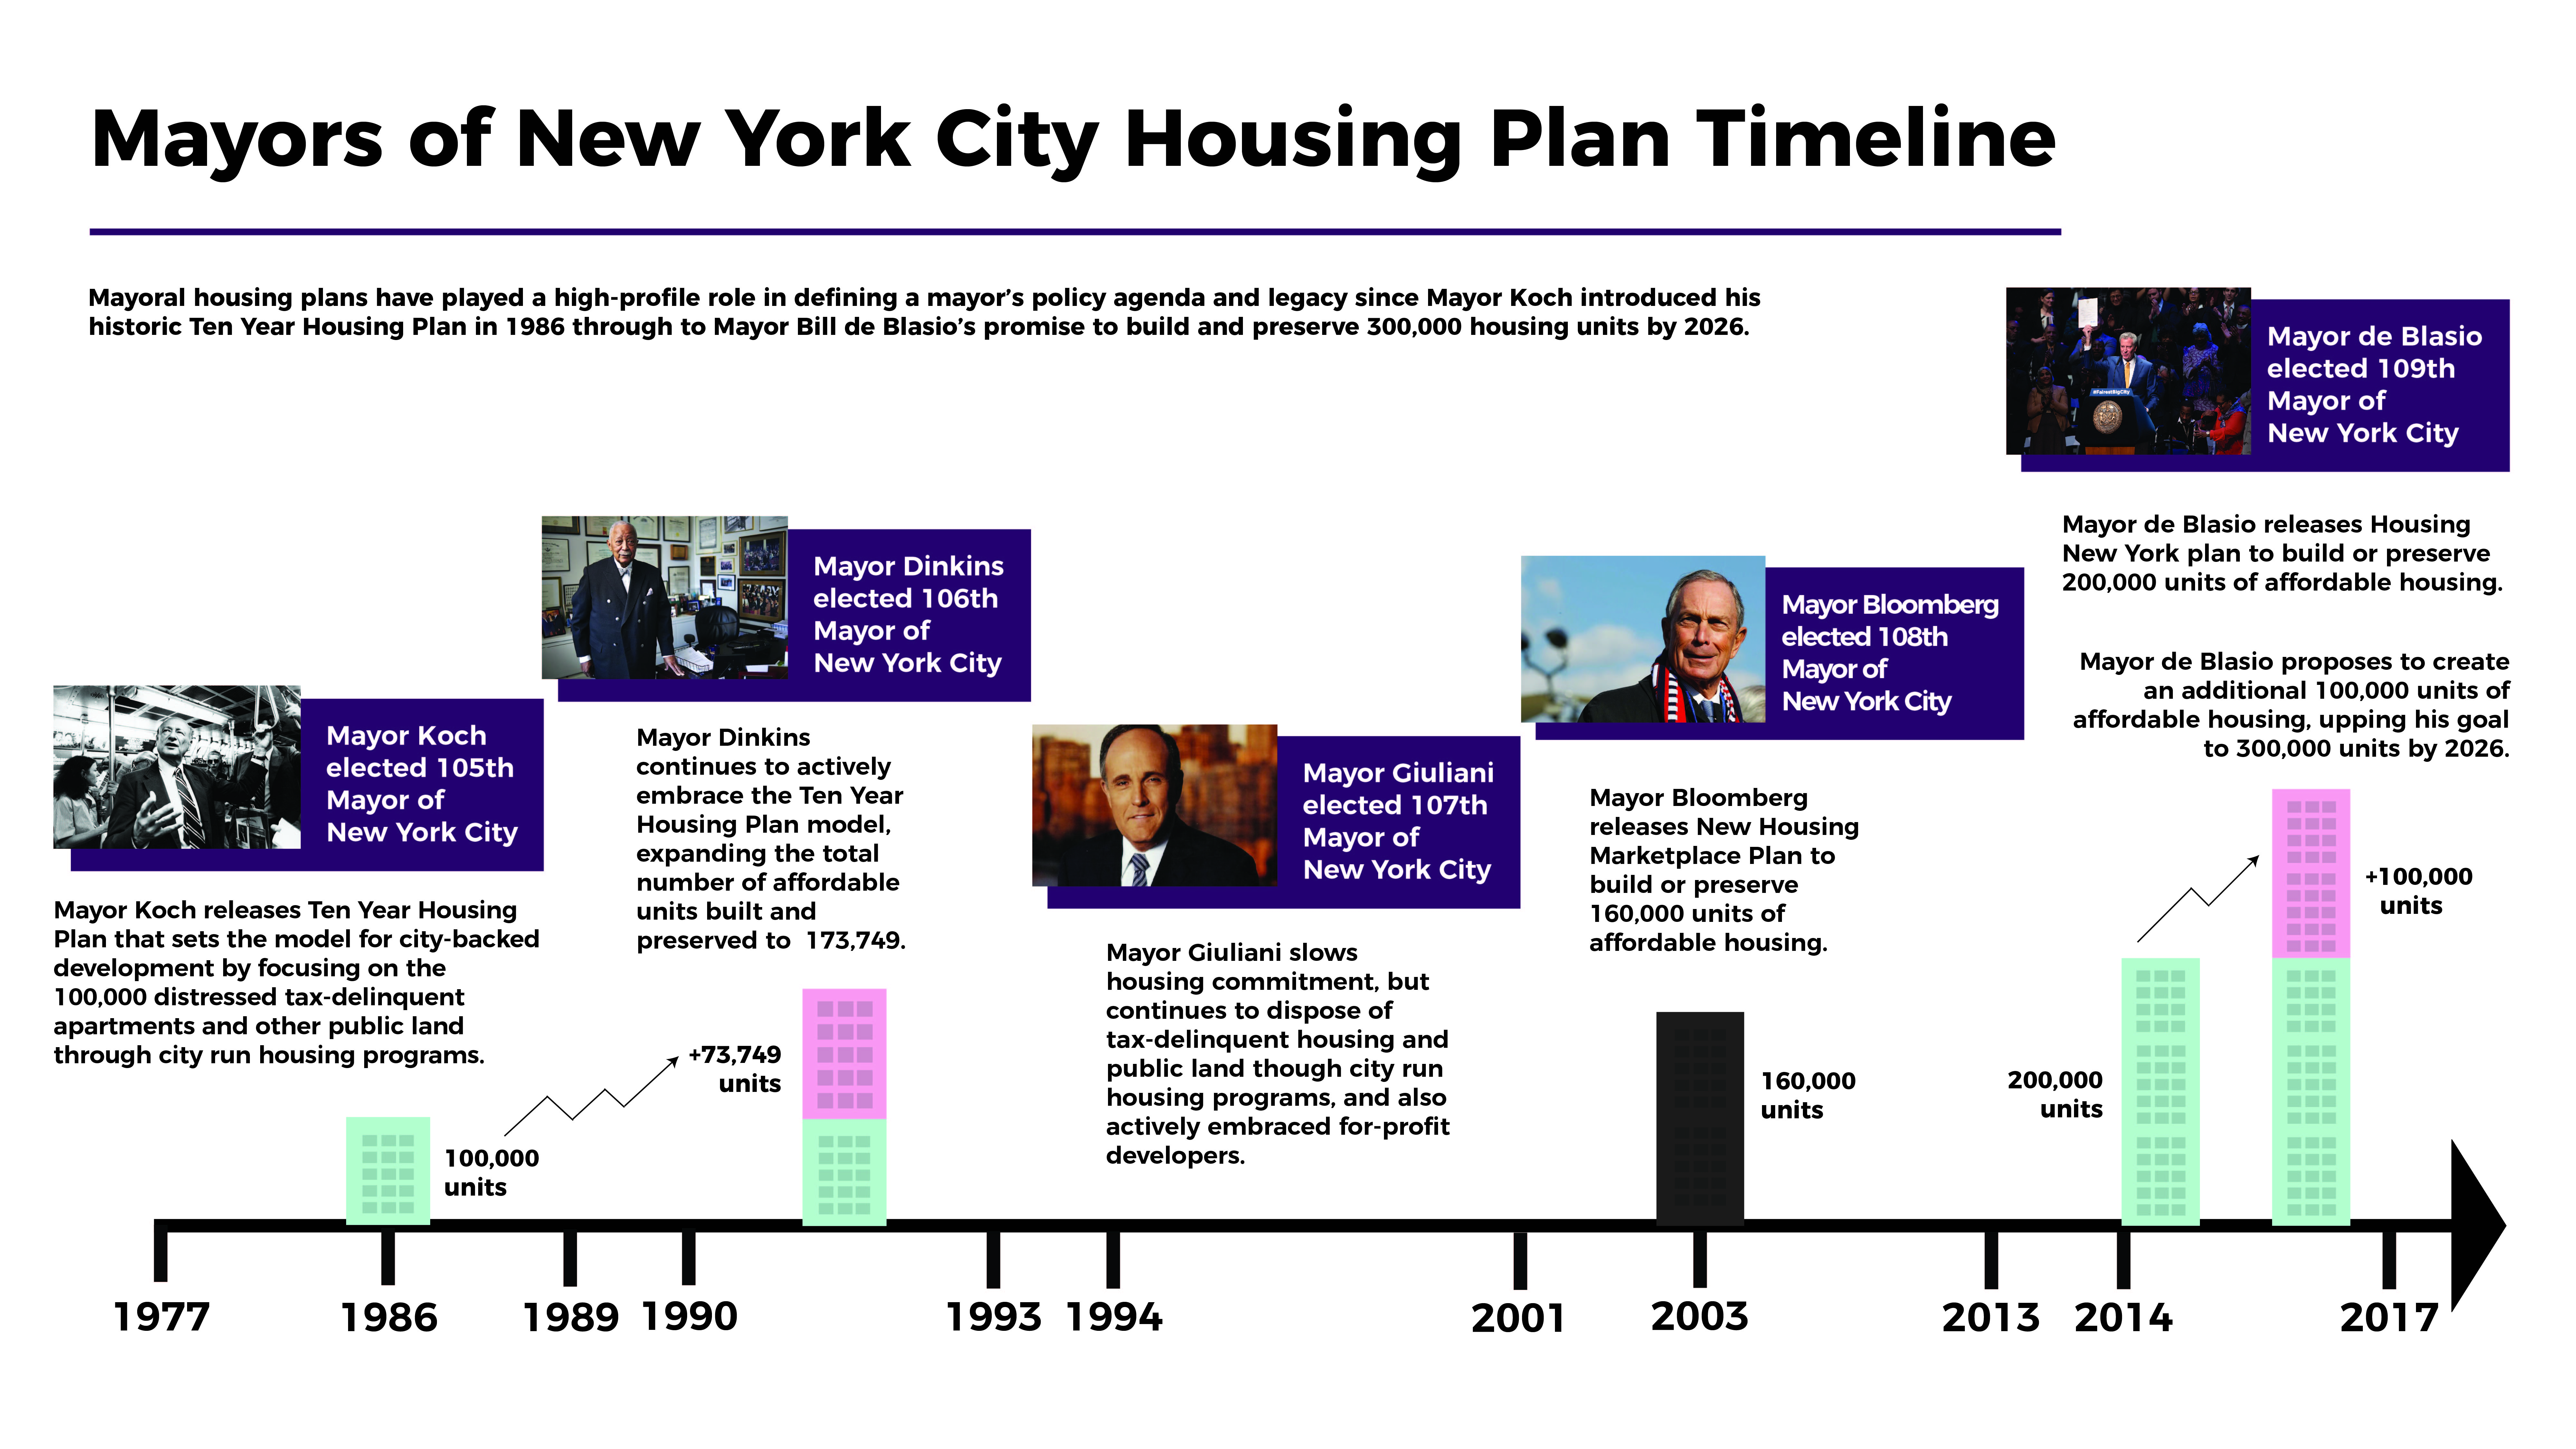
In New York City, mayoral housing plans have played a high-profile role in defining a mayor’s policy agenda and legacy since Mayor Ed Koch introduced his historic Ten-Year Housing Plan in 1986, which proposed to create over 100,000 units of affordable housing. Mayors Dinkins and Bloomberg have followed this basic approach in their mayoral agendas, most notably with Bloomberg’s 160,000 unit New Housing Marketplace plan. Because of a lack of desire from for-profit housing developers, the Koch and Dinkins plans relied heavily on local, mission-driven non-profit housing developers to build their affordable housing. That emphasis changed under the Giuliani and Bloomberg administrations where there was an intentional shift toward using more for-profit developers, showcasing the prioritization of large-scale business development over mission-driven development.
By the end of Mayor Bloomberg’s administration, his housing policies had created significant neighborhood friction, leading to the election of Mayor Bill de Blasio in 2014 on the promise of a renewed focus on deeply affordable housing. After taking office, Mayor de Blasio released his Housing New York Plan to create and preserve 200,000 units of affordable housing, which included the development of 80,000 new construction affordable units and preservation financing for 120,000 existing affordable units. In 2017, he proposed to create an additional 100,000 units, upping his goal to 300,000 units built and preserved by 2025. However, de Blasio’s housing plan, like those of his predecessors, prioritized the number of units to be produced rather than how the units will meaningfully tackle the affordability crisis itself.
In pursuit of a housing plan, the mayor works with the New York City Department of Housing Preservation and Development (HPD), the city agency responsible for creating and tracking the progress of city-backed affordable housing. HPD releases their affordable housing production numbers on a quarterly basis, from which you can determine:
- the number of units in each borough;
- the number of new construction and preservation-financed units; and
- basic information about the level of affordability of those units.
This information can help answer two central questions:
- Where and how is the City investing in affordable housing?
- Is the public getting the most benefit from our investment in affordable housing?
HPD’s quarterly analysis is useful, accurate and reliable, but that second question can be difficult to determine. Public benefit, or “public value” as this report defines it, in affordable housing development is not just measured by the number of units built. Public value also includes measuring the multiple ways in which housing is designed to meet neighborhood and city needs. The HPD quarterly analysis does not offer the full and nuanced information needed to evaluate key factors of public value in each unit it develops.
In this report, ANHD offers a unique analysis relying primarily on detailed information about HPD financed projects that have already gone through the construction closing process. Most of this data has been made available through Local Law 44, a 2012 law that requires HPD to collect and make public certain information about housing development projects receiving city financial assistance.
The Local Law 44 dataset allows us to better understand how and where public value is created. It also allows us to answer the following questions:
- What types of deals has HPD prioritized?
- What types of developers has HPD prioritized?
- How has subsidy been allocated?
- At what level has affordability been developed?
Affordable housing finance and policy is complex and must balance many factors, including the amount of subsidy available to the City, the needs of a particular neighborhood, and the overall city-wide housing policy goals. There is no one simple answer or single model for how the City should develop housing but taking into account metrics for development with the highest public value is an essential lens to assess the intent and the impact of a city’s housing plans.
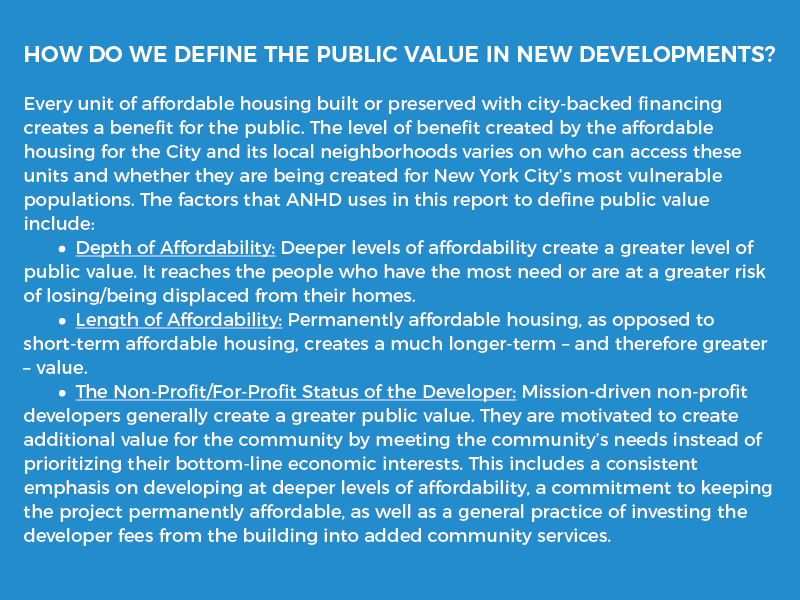
This report is an investigation of how the City is maximizing public value in city-financed affordable housing. By looking at depth of affordability, length of affordability, and what type of developer was used in the analyzed housing projects, we found:
Key Findings
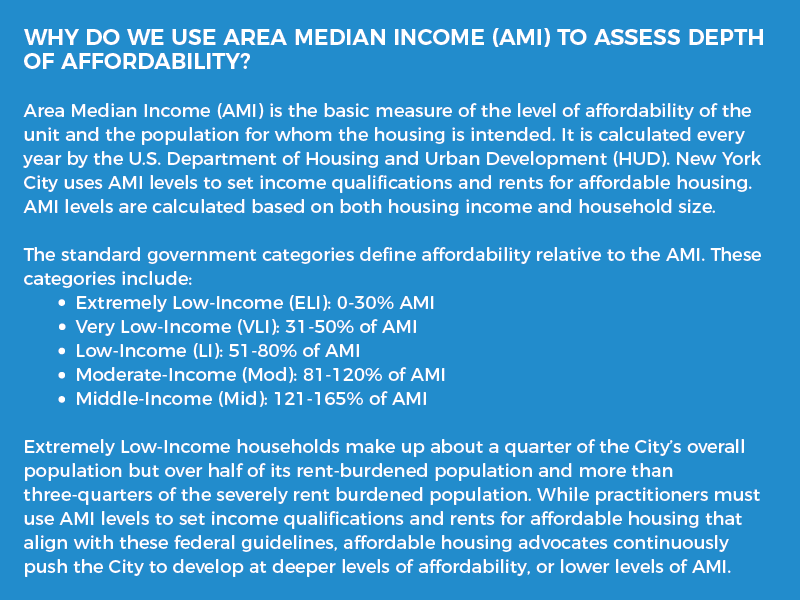
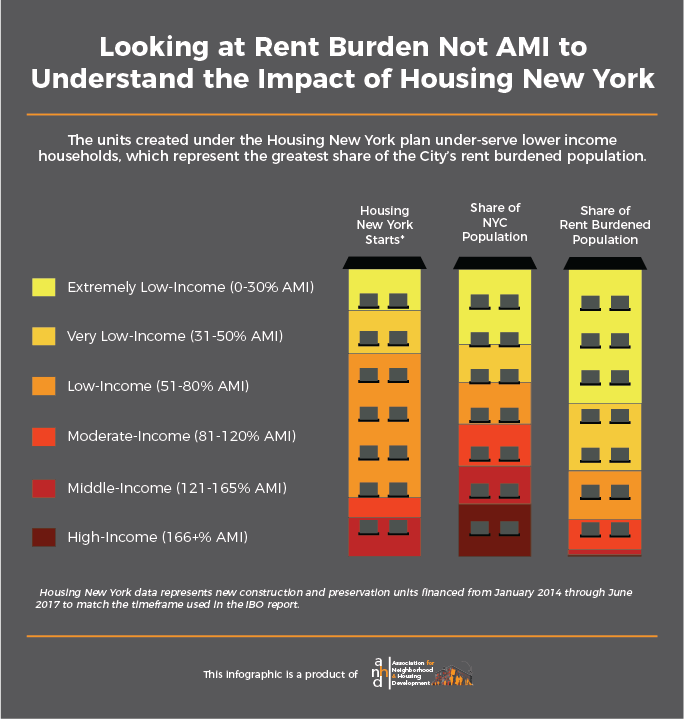
42% of the total units developed to date were for Low-Income households; 25% were developed for Very Low-Income households; and 17% were built to Extremely Low- Income households. However, these numbers are the inverse of the actual city-wide need. Very Low- and Extremely Low-Income households make up 41.4% of the City’s population, while Low-Income households only make up 16.3% of the City’s population.
In 2015, the de Blasio Administration issued a new affordable housing term sheet that reached Extremely Low-and Very Low-Income levels of affordability. Units built at these affordability levels represent 42% of the total units built under de Blasio’s housing plan, showcasing how revised term sheets have allowed for deeper affordability.
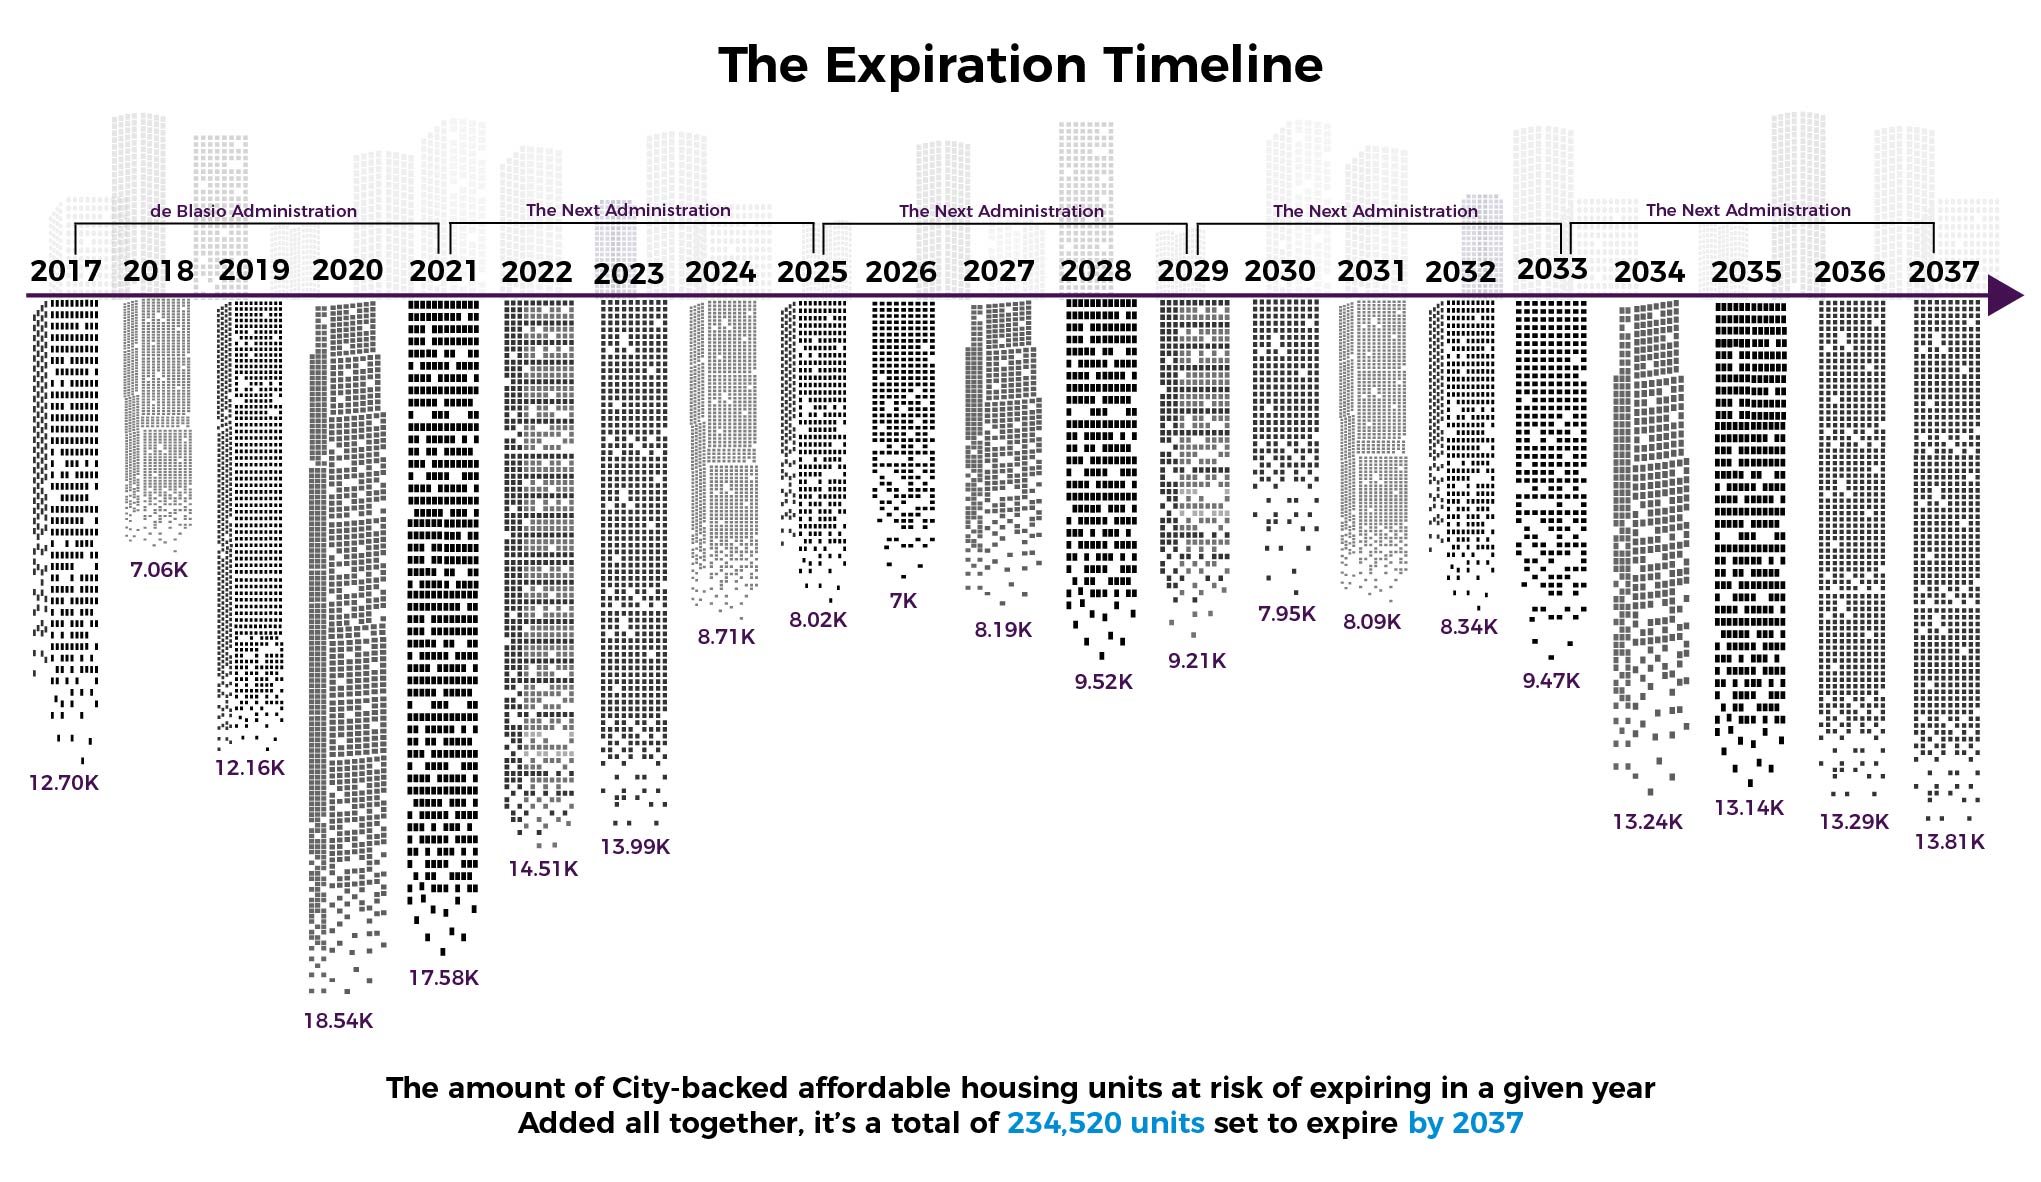
There are 234,520 city-backed affordable units that will reach the expiration of their initial affordability between 2017 and 2037. There is no way to accurately predict which of these units or how many will lose their affordability through a developer choosing to opt-out. However, the past few years indicate that units controlled by mission-driven non-profit developers will see their affordability restrictions renewed, while buildings controlled by for-profit developers will face the danger of opting out of affordability restriction when the initial regulatory agreement expires.
The City has implemented a number of policies to address the expiring-use crisis, such as issuing new regulatory requirements to ensure all affordable housing built on city-owned land through the Request for Proposal (RFP) process maintains affordability in perpetuity, requiring all affordable units built under the Mandatory Inclusionary Housing (MIH) program are permanently affordable, and more. However, while new development financed under a city-issued RFP is protected, that is only one category of city-financed housing.
Since mission-driven non-profit developers make development decisions independent of an individual bottom-line economic interest, it is understood that they can deliver an especially high level of public value. However, for-profit developers accounted for 71% of new construction deals, while non-profit developers accounted for just 29% of new construction deals.
The four-year Fiscal Year data analyzed shows that 35% of the total new construction units developed by non-profit developers were Extremely Low-Income units, compared to 18% of the total new construction units developed by for-profit developers. Yet, in Fiscal Year 2018, for-profits accounted for 75% of new construction units, while non-profits developed 25% of the units.
Although the discrepancy between mission-driven developers and their for-profit counterparts is not as great as it is in new construction units, the data shows an imbalance between the number of deals closed and the number of units preserved, with for-profits accounting for 67% of the preservation units while non-profit developers accounted for only 33% of preservation units.
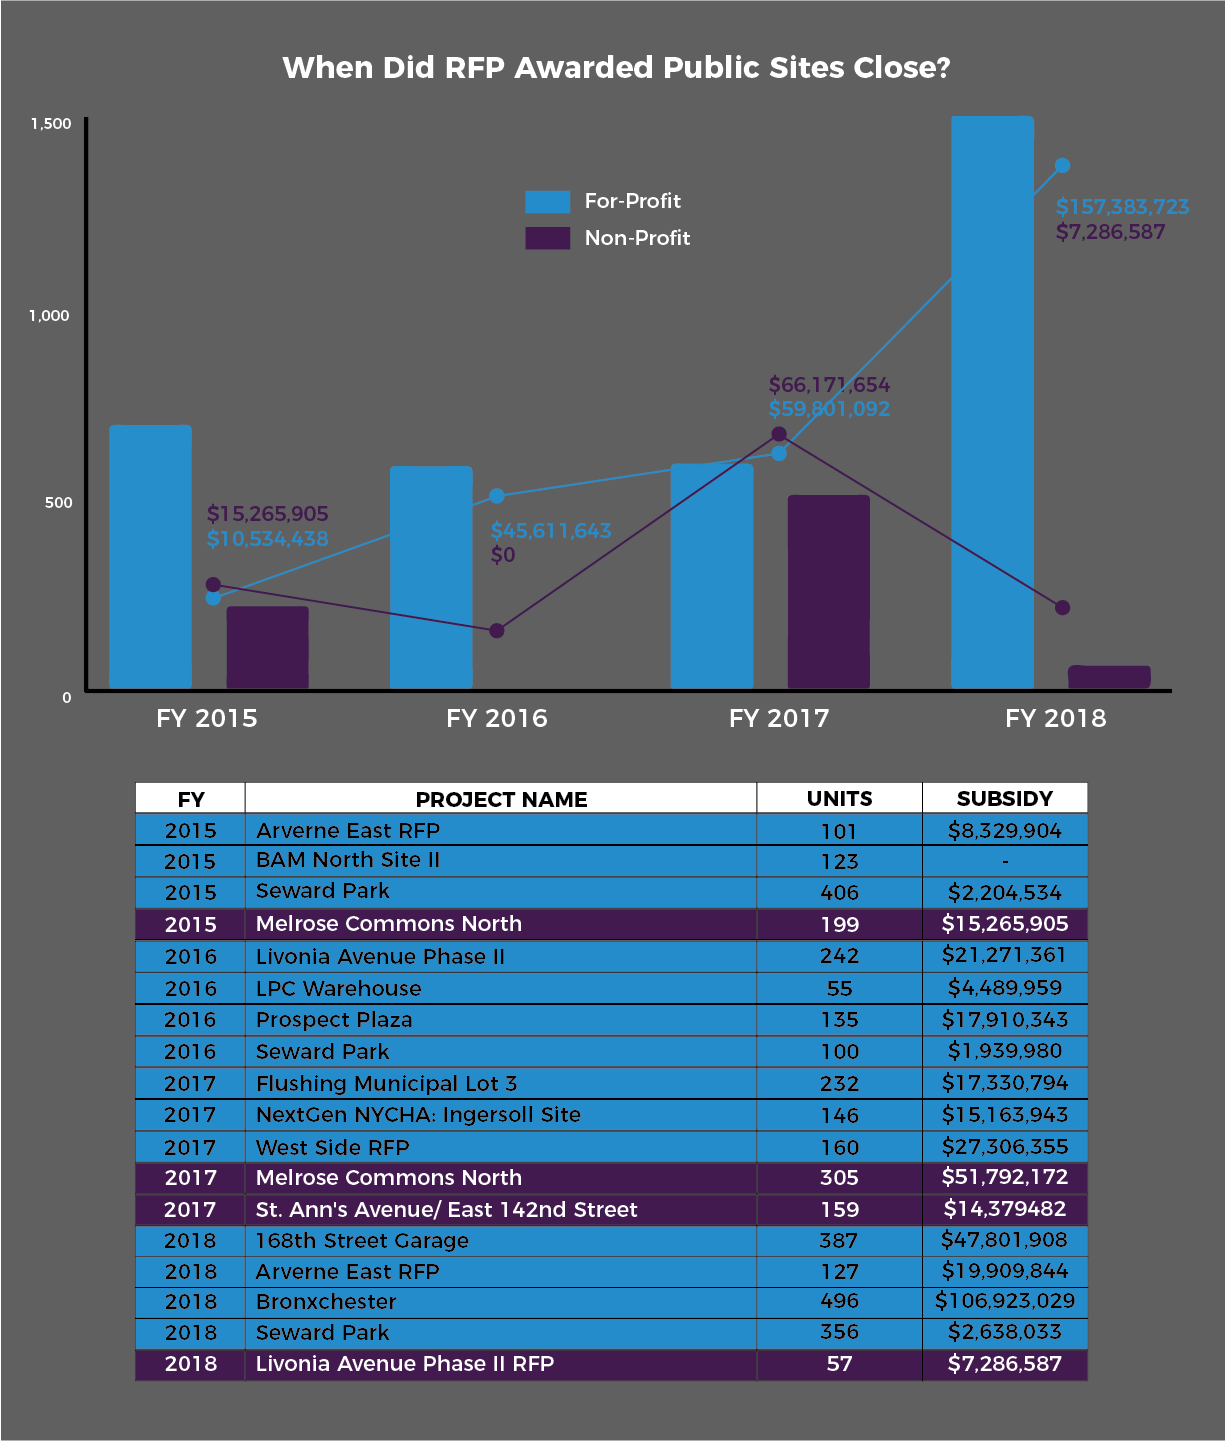
The discrepancy between the percentage of projects on city-owned land awarded to mission-driven non-profit verses for-profit developers has decreased since Mayor de Blasio took office, but it is still not high enough to secure permanently affordable housing by mission-driven developers on public land. Between July 2014 and June 2018, 75% of RFP-selected new construction projects went to for-profit developers and 25% went to non-profit developers.
There is an imbalance of the total amount of city subsidy allocated to each category of developer, with for-profit developers receiving 72% of the total subsidy allocated between July 2014 and June 2018.
Analyzing the Trends: Depth of Affordability
Local Law 44 data provides a clear picture of what was built and preserved under the de Blasio housing plan, and for whom it was built.1 In the de Blasio plan to date, 44% of the total units developed were for Low-Income households, 20% were developed for Very Low-Income households, and 23% were built to Extremely Low- Income households. New Construction units were more likely to be Low-Income, with 47% of those units in that category, while preservation units were more likely to be Very Low-Income, with 39% of the units in that category. This means that most new construction units were developed for a 3-person household making between $57,660 and $76,880 annually, and most units were preserved for a 3-person household making between $38,440 and $48,050 annually. Housing New York is developing at deep levels of affordability, but not deep enough for New York’s needs.
| Extremely Low-Income | Very Low-Income | Low-Income | Moderate-Income | Middle-Income | |
|---|---|---|---|---|---|
| New Construction | 3,626 | 2,417 | 7,621 | 1,180 | 1,383 |
| Preservation | 1,194 | 1,916 | 1,794 | 57 | 0 |
| Total | 4,820 | 4,333 | 9,415 | 1,237 | 1,383 |
| Extremely Low-Income | Very Low-Income | Low-Income | Moderate-Income | Middle-Income | |
|---|---|---|---|---|---|
| New Construction | 22% | 15% | 47% | 7% | 9% |
| Preservation | 24% | 39% | 36% | 1% | 0% |
| Total | 23% | 20% | 44% | 6% | 7% |
 Over the past six years, the de Blasio Administration has taken steps to create financing tools and policies that can achieve deeper levels of affordability and better align the income level of the housing that is built with the local- and city-wide need. There is a significant mismatch between the AMI levels of the plan’s housing goals and the need shown by the demographic profile of the city’s population. Forty-two percent of the total units developed to date were for Low- Income households; 25% were developed for Very Low-Income households; and 17% were built to Extremely Low-Income households. Those numbers are the inverse of the actual city-wide need. Very Low- and Extremely Low-Income households make up 41.4% of the City’s population, while Low-Income households only make up 16.3% of the City’s population. While the de Blasio Administration has taken some steps forward by creating new financing and policy tools to create lower levels of affordability, the overall balance of the Housing New York plan is still out of step with the city-wide demographic need.
Of note, the Administration has revised term sheets and implemented Mandatory Inclusionary Housing (MIH) to address this discrepancy. However, this report does not evaluate the housing created under the City’s Inclusionary Housing program unless that housing used city-backed financing. It is notable that the Mandatory Inclusionary Housing program signed into law by the de Blasio Administration includes some categories that require housing affordable to levels as low as 40% of AMI or $37,560 for a family of three. These lower levels account for a small portion of the affordability required under Mandatory Inclusionary Housing, but it is the lowest level of affordability of any inclusionary housing program in the country. The Housing New York Plan is currently underserving lower-income households, which represent the largest rent-burdened population. Having these lower levels in place have helped the City reach these lower-income households.
REVISED TERM SHEETS HAVE ALLOWED FOR DEEPER AFFORDABILITY
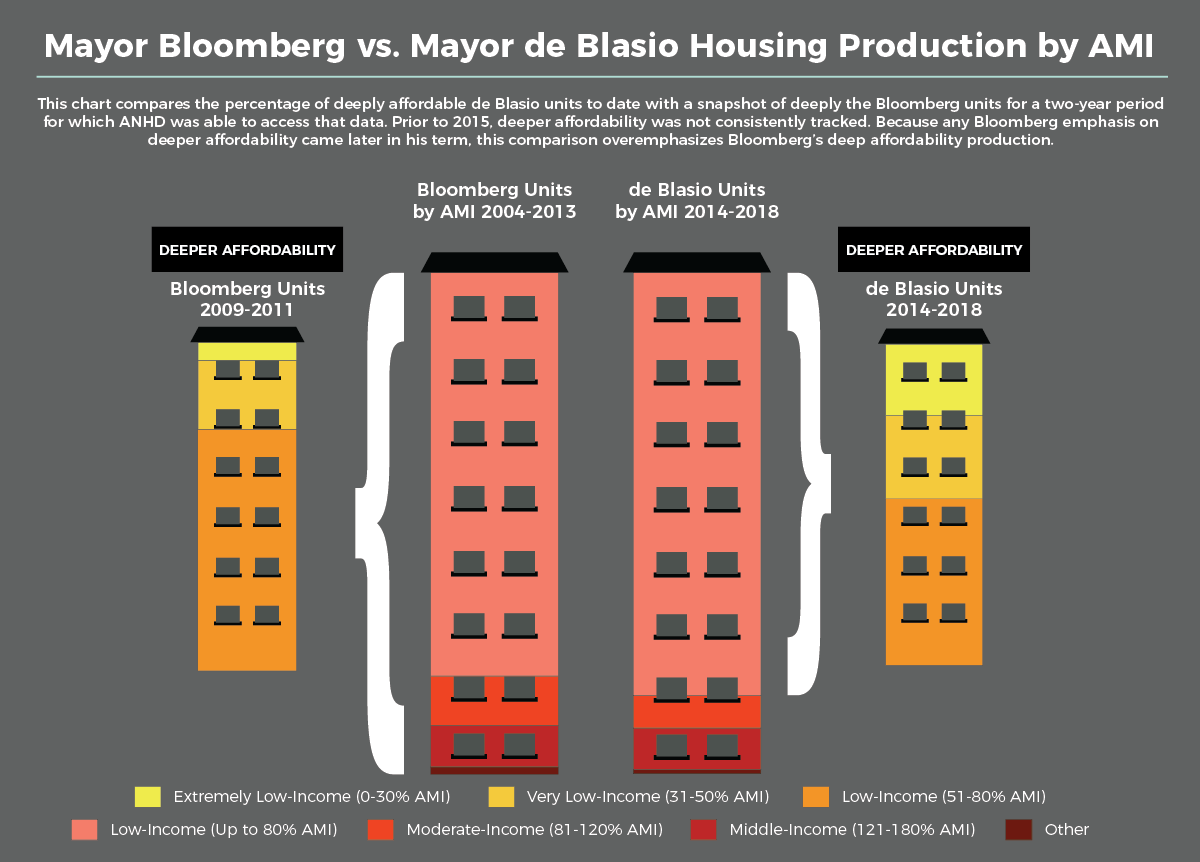 From the Koch Administration on, the affordability level of most city-backed affordable housing has been pegged to a standard range set by the federal Low-Income Housing Tax Credit (LIHTC) and Private Activity Bond (PAB), which are the core financing tools for most affordable deals. The most standard range for LIHTC and PAB terms sits at 60% of AMI or $57,660 for a household of three; however, the City can layer additional financing or requirements in city-backed deals to bring the AMI level more in-line with local needs and policy goals.
The de Blasio Administration took a notable step in 2015 when they recognized a need for lower incomes and issued a new affordable housing term sheet that reached Very Low and Extremely Low levels of affordability. Prior to 2015, there was no standard AMI category for city-backed development below Low-Income, making this a crucial financing tool in the development of deeply affordable housing. While previous mayoral administrations built small amounts of deeply affordable housing, it was neither emphasized in their housing plans nor tracked in their reporting. Extremely Low-Income and Very Low-Income units built under the de Blasio plan represent 42% of the total units built, which is an advancement in New York City housing development policy.2
Analyzing the Trends: Length of Affordability
Affordable housing is only affordable for the term of the financing or the regulatory agreement. Until recently, the standard minimum term required by LIHTC and PAB was 30 years. However, the City can lengthen the required term of affordability for any developer seeking to use city capital. When the Koch Administration first began building LIHTC-financed housing at-scale, the 30-year affordability period seemed so distant as to not be an issue.
However, much of the housing built during those early years is now coming up for expiration. Housing in neighborhoods where LIHTC-level rents are significantly below market-rate is in serious danger of losing its affordability restriction. This is most likely to happen if the developer is a for-profit seeking to maximize their bottom line. Expiring restrictions results in the loss of existing affordable housing for the City.
THE EXPIRING-USE CRISIS
What has become known as the “expiring-use crisis,” first became apparent in federally-backed Section 8 housing developments and state-backed Mitchell-Lama housing developments. Over the past decade, as these projects reached the time when the developer could opt-out of continuing the affordability requirements, local neighborhoods have lost tens of thousands of affordable units that have transitioned to market-rate after the initial affordability term expired. There is a similar crisis already beginning to occur in city-backed affordable housing, as the housing built under Mayor Koch’s housing plan begins to reach the end of the 30-year affordability requirement.
New York City has already seen many cases of city-financed housing begin to lose affordability, and the scale of this potential crisis continues to grow. New York City may soon lose as many existing affordable units each year through expiring affordability as can be created through costly city-backed financing programs. According to an ANHD analysis, there are 234,520 city-backed affordable units that will reach the expiration of their initial affordability between 2017 and 2037.3
The below chart shows the number of city-backed affordable housing units that had their affordability restrictions expire beginning in 2017, illustrating the potential scale of the coming expiring-use crisis.
There is no way to accurately predict which of these units or how many of these units will lose their affordability through a developer choosing to opt-out. However, the past few years indicate that units controlled by mission-driven non-profit developers will see their affordability restrictions renewed when the initial regulatory agreement expires. The evidence of the past few years also makes it clear that it is likely that buildings controlled by for-profit developers will face the danger of opting out of affordability restriction when the initial regulatory agreement expires.
While the existing data is limited, it does show that for-profit developers have a bottom-line incentive to opt-out of the affordability if and when they can, and if and when the market-rate rents in the neighborhood where the housing is located is greater than the rents that would be allowed by an affordable housing regulatory restriction. In contrast, mission-driven non-profit developers generally chose to renew the affordability terms, preserving the value of the development for the community and the taxpayer.
While Local Law 44 data does not include this information about the length of affordability of the units, we evaluated the progress the current Administration has made by tracking policies that would advance this priority.
In 2017, HPD implemented a new long-term affordability policy by issuing new regulatory requirements. This allows HPD to ensure all affordable housing built on city-owned land through the Request for Proposal (RFP) process maintains affordability in perpetuity. This innovative mechanism creates a “remainder right” in the land disposition agreement. It gives the City the ability to exercise its discretion to require the renewal of the affordability term when the original regulatory agreement is set to expire. This policy does not solve the existing expiring-use problem, but it does ensure future developments remain under the City’s control and do not fall out of affordability once the regulatory agreement has expired.
Additionally, the Mandatory Inclusionary Housing program signed by Mayor de Blasio in 2016 requires all affordable units built under that program be permanently affordable.
The City has also successfully supported lengthening affordability terms in New York City and the New York State Qualified Allocation Plan (QAP), which set the baseline for LIHTC eligibility. Under the de Blasio Administration, the Qualified Allocation Plan has actively encouraged affordability terms of 60 years. This is a significant improvement over the formerly standard 30-year requirement.
The City also instituted a requirement of permanent affordability for all affordable housing built on New York City Housing Authority (NYCHA) land under the NEXTGeneration NYCHA plan by ground-leasing the development land instead of selling it outright, giving the City an important new model of long-term regulatory control.
Taken together, these policies represent a step forward for the urgent issue of long-term affordability policy. However, there are still major gaps in the City’s approach. While new development financed under a city-issued RFP is protected, that is only one category of city-financed housing. A significant percentage of new affordable housing developments occur with city-financing, but not on city-owned land that would allow the issuance of an RFP. Until a mechanism for permanent affordability is attached to every basic LIHTC and PAB regulatory agreement, the City will continue to recreate the expiring-use crisis.
Additionally, the Administration’s progress in addressing the expiring-use crisis is directly undermined by a continued emphasis on prioritizing for-profit affordable housing developers over mission-driven developers.
Analyzing the Trends: Comparing Mission-Driven & For-Profit Development
Mission-driven non-profit affordable housing developers have played a key role in New York City housing plans since the beginning of the modern, city-backed affordable housing model. These institutions are primarily run by people from the communities they serve and hold a mission of creating affordable housing based on the needs of the community. Since mission-driven non-profit developers make development decisions independent of an individual bottom-line economic interest, it is understood that they can deliver an especially high level of public value.4
Historically, for-profits participated in affordable housing development through joint ventures with non-profits to provide additional resources and capacity for projects. As more affordable housing was developed through the Mayor Koch and Dinkins administrations, the landscape became more challenging due to limited land and complicated deal structures. Mayors Giuliani and Bloomberg’s market driven ideologies led them to create policies that emphasized allowing for-profit developers to take a central role as primary developers and long-term owners of projects. This trend towards the for-profitization of affordable housing development has concerned many observers that the greatest public value is being undermined by the economic interests of for-profit developers.
FOR-PROFIT DEVELOPERS CONTINUE TO BE PRIORITIZED OVER MISSION-DRIVEN DEVELOPERS
Local Law 44 Data shows that the de Blasio Administration has continued the general trend of emphasizing development by for-profit developers. This is especially true for new construction projects where for-profit developers were heavily favored. Between Fiscal Years 2014 and 2018, there were 184 for-profit entities and 100 non-profit entities that accounted for the total 284 individual projects, and 49,752 units analyzed by ANHD. For-profit developers accounted for 71% of new construction deals, while non-profit developers accounted for just 29% of new construction deals. The discrepancy is even greater when accounting for the number of units created. For-profit developers accounted for 79% of the new construction units, while non-profit developers accounted for only 21% of the new construction units.
It is relevant to note that subsequent to the most currently available Local Law 44 data (Fiscal Year 2018), public announcements by HPD suggest that the agency has awarded a greater share of new construction deals to mission-driven non-profit developers than they did in the first five years of the de Blasio Administration.
The data also shows that non-profit developers accounted for 41% of preservation deals, and for-profit developers accounted for 59% of preservation deals. Although, the discrepancy between mission-driven developers and their for-profit counterparts is not as great as it is in new construction units, the data shows an imbalance between the number of deals closed and the number of units preserved, with for-profits accounting for 67% of the preservation units while non-profit developers accounted for only 33% of preservation units.
This imbalance not only limits non-profits to smaller, more challenging deals, but it also prevents non-profit developers from having a broader mission-driven impact on the Housing New York plan. Non-profit developers rely on new construction deals to expand capacity, since this type of deal allow for significantly higher developer fees than preservation deals.
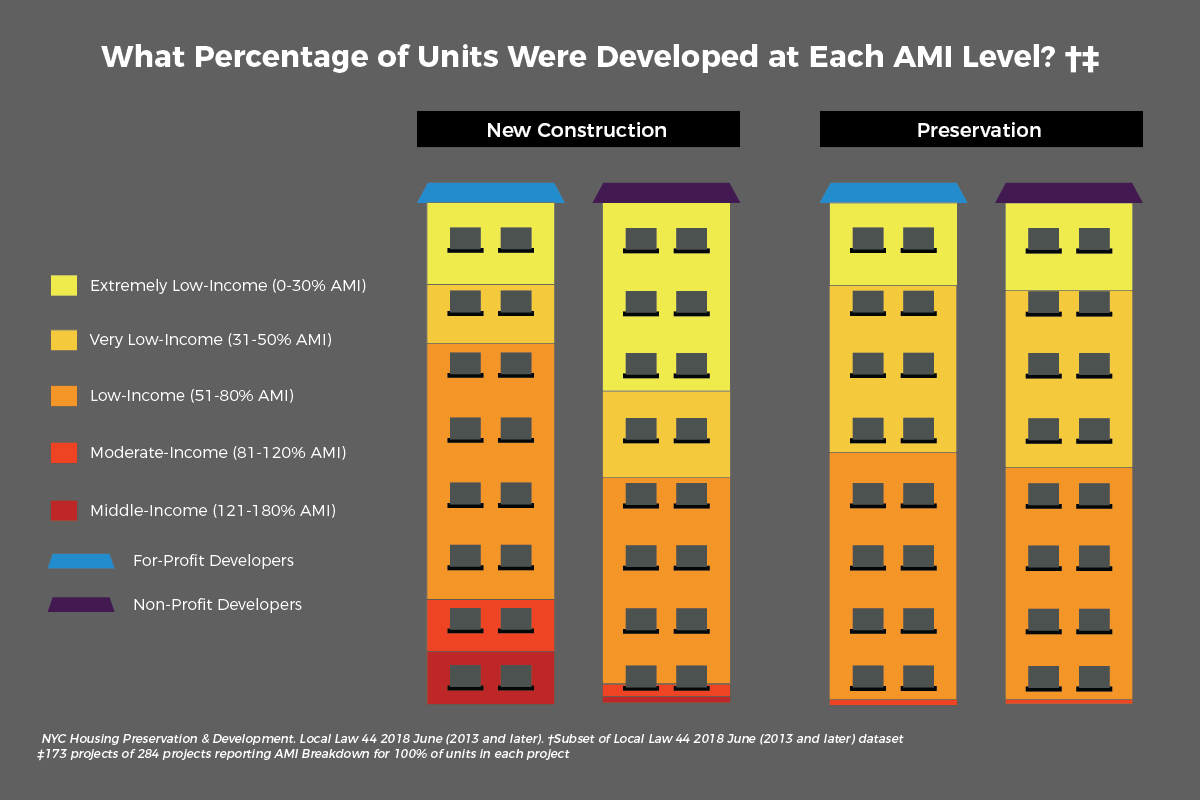
MISSION-DRIVEN NON-PROFIT DEVELOPERS CONTINUE TO DEVELOP FOR LOWER INCOME LEVELS
The impact of the for-profitization trend shown in the available Local Law 44 data on public value can be seen in the level of affordability of the units created. The four-year Fiscal Year data analyzed shows that 35% of the total new construction units developed by non-profit developers were Extremely Low-Income units, compared to 18% of the total new construction units developed by for-profit developers. In contrast, for-profits built 20% of their total new construction units in the Moderate- and Middle-Income categories, compared to mission-driven developers who only assigned 5% of their total units to these categories.
Non-profits have developed a significantly higher percentage of Extremely, Very Low-, and Low-Income units in new construction deals. Although for-profits and non-profits have access to the same subsidy programs and consider the same Request for Proposal (RFP) requirements for public sites, non-profit developers have consistently committed to deeper levels of affordability.
| Extremely Low-Income | Very Low-Income | Low-Income | Moderate-Income | Middle-Income | |
|---|---|---|---|---|---|
| New Construction | 3,626 | 2,417 | 2,417 | 1,180 | 1,407 |
| For-Profit | 2,166 | 1,614 | 6,008 | 1,033 | 1,311 |
| Non-Profit | 1,460 | 803 | 1,638 | 147 | 96 |
| Preservation | 1,194 | 1,916 | 1,687 | 57 | 0 |
| For-Profit | 804 | 1,275 | 1,914 | 37 | 0 |
| Non-Profit | 390 | 641 | 773 | 20 | 0 |
| Total | 4,820 | 4,333 | 9,333 | 1,237 | 1,407 |
NEW CONSTRUCTION DEALS ARE DISPROPORTIONALLY GOING TO FOR-PROFIT DEVELOPERS
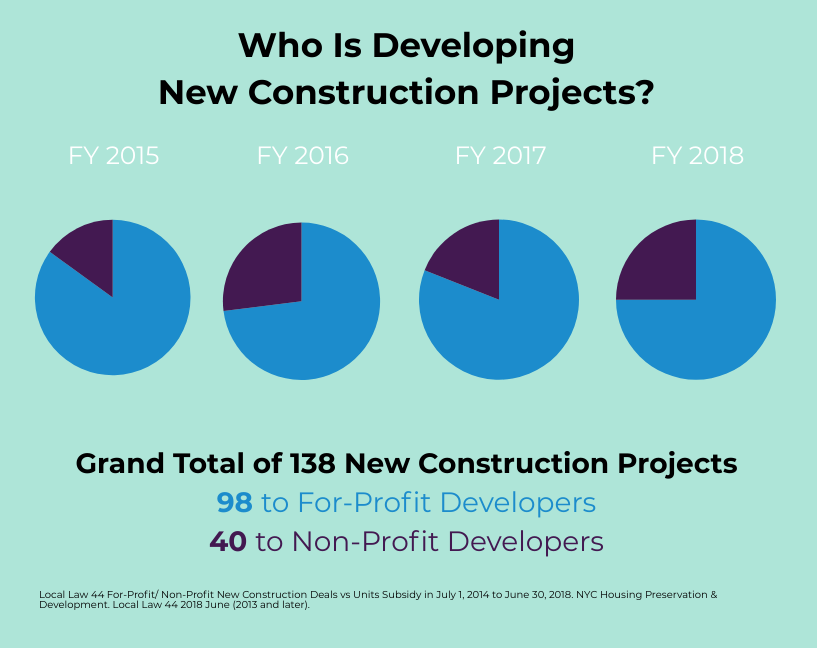 The City awards subsidies on a competitive basis for developers who build affordable housing on privately-owned or publicly-owned land. Local Law 44 data shows that for-profits close more deals than mission-driven non-profit developers on a yearly basis. For-profit developers accounted for 85% of the new construction units, while non-profit developers accounted for 15% of the new construction units in Fiscal Year 2015. In Fiscal Year 2016, the number of units developed by for-profit developers decreased significantly, although they accounted for 73% of the total new construction units for the year. Non-profit developers were constructing more units than they did the prior fiscal year, but still only accounted for 27% of the new construction units. For-profit developers accounted for 81% of the new construction units in Fiscal Year 2017, while non-profit developers accounted for only 19%. In Fiscal Year 2018, for-profits accounted for 75% of new construction units, while non-profits developed 25% of the units.
As mentioned earlier, new construction deals allow for significantly higher developer fees than preservation deals. Therefore, when for-profits are prioritized over non-profits for new construction deals, it prevents non-profit developers from expanding their capacity, thus depriving communities from added public value.
FOR-PROFIT DEVELOPERS ARE GIVEN MORE PRESERVATION OPPORTUNITIES THAN MISSION-DRIVEN DEVELOPERS
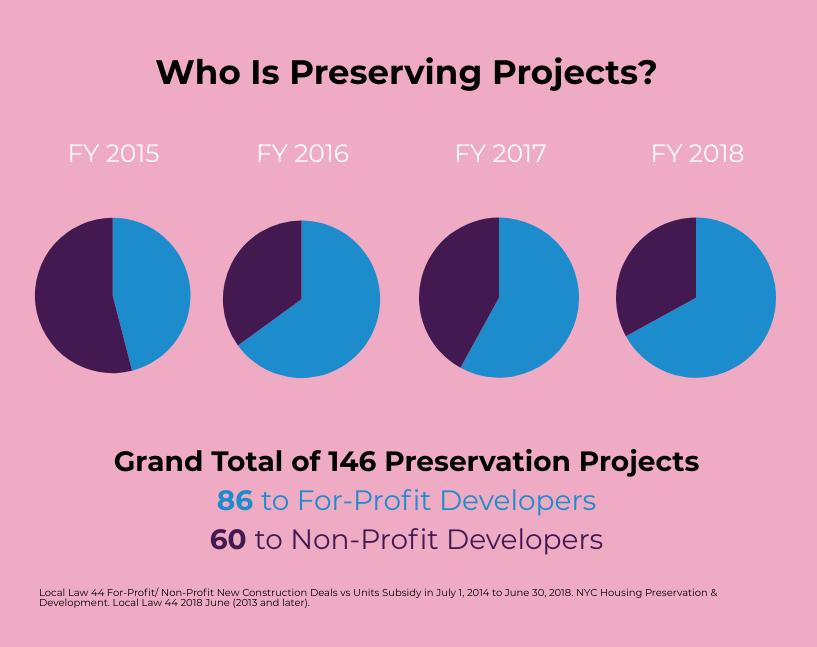 Affordable housing preservation deals represent the majority of units in the de Blasio housing plan. An analysis of preservation units in Local Law 44 data shows that non-profit developers accounted for 41% of preservation deals, and for-profit developers accounted for 59% of preservation deals. Although the discrepancy between mission-driven developers and their for-profit counterparts is not as great as it is in new construction units, the data shows an imbalance between the number of deals closed and the number of units preserved, with for-profits accounting for 67% of the preservation units while non-profit developers accounted for only 33% of preservation units. This means for-profit developers are closing 42% more projects and working on larger-scale projects that yield significantly more units than non-profit deals.
For-profits and non-profits each accounted for 50% of the preservation units in Fiscal Year 2015. However, in Fiscal Year 2016, for-profits accounted for 70% of units while non-profits accounted for only 30% of the units. This information suggests that for-profits were given more preservation opportunities or completed larger projects than non-profits. While the gap closed slightly in Fiscal Year 2017, for-profits accounted for 61% of units and non-profits accounted for 39% of the units; and in Fiscal Year 2018, for-profits developed 88% of the total preservation units, while non-profits preserved only 12% of total units. The data shows that on a yearly basis, the de Blasio administration has closed bigger deals with for-profit developers.
| Total Project Units | Percentage of Total Project Units | Total Projects | Percentage of Total Projects | Percentage of Projects by Construction Type | |
|---|---|---|---|---|---|
| New Construction | 21,770 | 44% | 138 | 49% | 100% |
| For-Profit | 17,113 | 34% | 98 | 35% | 71% |
| Non-Profit | 4,657 | 10% | 40 | 14% | 29% |
| Preservation | 27,982 | 56% | 146 | 51% | 100% |
| For-Profit | 18,628 | 37% | 86 | 30% | 59% |
| Non-Profit | 9,354 | 19% | 60 | 21% | 41% |
| Total | 49,752 | 100% | 284 | 100% |
| FY 2015 | FY 2016 | FY 2017 | FY 2018 | Total Projects | |||||
|---|---|---|---|---|---|---|---|---|---|
| For-Profit | 28 | 74% | 20 | 62.5% | 25 | 81% | 25 | 68% | 98 |
| Non-Profit | 10 | 26% | 12 | 36.5% | 6 | 19% | 12 | 32% | 40 |
| Total | 38 | 32 | 31 | 37 | 138 |
| FY 2015 | FY 2016 | FY 2017 | FY 2018 | Total Projects | |||||
|---|---|---|---|---|---|---|---|---|---|
| For-Profit | 17 | 46% | 28 | 65% | 21 | 58% | 20 | 67% | 86 |
| Non-Profit | 20 | 54% | 15 | 35% | 15 | 42% | 10 | 33% | 60 |
| Total | 37 | 43 | 36 | 29 | 146 |
NON-PROFIT DEVELOPMENT ON CITY OWNED LAND
Development on city-owned land requires that a developer is chosen through a city-managed Request for Proposals (RFP) process. City-owned land developments accounted for one-third of the total affordable housing development activity in New York City. The other two-thirds of development activity consisted of preservation financing of existing affordable units and new construction opportunities brought to the City by developers. The discrepancy between the percentage of projects on city-owned land awarded to mission-driven non-profit verses for-profit developers has decreased since Mayor de Blasio took office, but it is still not high enough to secure permanently affordable housing by mission-driven developers on public land. Between July 2014 and June 2018, 75% of RFP-selected new construction projects went to for-profit developers and 25% went to non-profit developers. While the universe of RFP projects is modest – there were twelve total RFPs that would create affordable rental housing in the time period analyzed for this report.
Public announcements by HPD suggest that subsequent to the most currently available Local Law 44 data, HPD has awarded a greater share of new construction deals to mission-driven non-profit developers than they did in the first five years of the de Blasio Administration. The public announcement of development awards on public sites include over 12,000 units that will be built by non-profit developers. ANHD will update this report to reflect that new data when it is available.
FOR-PROFIT DEVELOPERS ARE RECEIVING THE MAJORITY OF CITY SUBSIDY FOR AFFORDABLE HOUSING DEVELOPMENT
HPD has given a total of $2.94 billion in city subsidy to permanent rental affordable housing projects from July 2014 to June 2018.5 There is an imbalance of the total amount of city subsidy allocated to each category of developer, with for-profit developers receiving 72% of the total subsidy allocated between July 2014 and June 2018.
Of total subsidy amount, $2.24 billion went to new construction deals with 79% of that total allocated to for-profits and 21% allocated to non-profit developers. Preservation projects received a total of $700 million in subsidy with non-profit developers receiving 48% of the total preservation subsidy, and for-profit developers receiving 52% of the preservation subsidy.
| Total Project Units | Total Subsidy | Percentage (%) of Total Subsidy | |
|---|---|---|---|
| New Construction | 21,770 | $2,242,027,391 | 76% |
| For-Profit | 17,113 | $1,761,463,831 | 79% |
| Non-Profit | 4,657 | $480,563,560 | 21% |
| Preservation | 27,982 | $700,500,795 | 24% |
| For-Profit | 18,628 | $364,874,977 | 52% |
| Non-Profit | 9,354 | $335,625,818 | 48% |
| Grand Total | 49,752 | $2,942,528,186 | 100% |
| Average Subsidy Per Unit | Total Project Units | Sum of Total Subsidy | |
|---|---|---|---|
| New Construction | $102,987 | 21,770 | $2,242,027,391 |
| For-Profit | $102,931 | 17,113 | $1,761,463,831 |
| Non-Profit | $103,192 | 4,657 | $480,563,560 |
| Preservation | $25,034 | 27,982 | $700,500,795 |
| For-Profit | $19,587 | 18,628 | $364,874,977 |
| Non-Profit | $35,880 | 9,354 | $335,625,818 |
| Totals | 49,752 | $2,942,528,186 |
| FY 2015 | FY 2016 | FY 2017 | FY 2018 | Grand Total | |
|---|---|---|---|---|---|
| New Construction | $55,072 | $100,178 | $105,805 | $142,980 | $102,987 |
| For-Profit | $50,479 | $103,674 | $102,727 | $152,873 | $102,931 |
| Non-Profit | $80,885 | $90,671 | $118,544 | $113,248 | $103,192 |
| Preservation | $19,287 | $34,213 | $25,502 | $18,629 | $25,027 |
| For-Profit | $25,486 | $15,023 | $25,510 | $17,064 | $19,576 |
| Non-Profit | $13,120 | $80,057 | $25,489 | $29,684 | $35,880 |
Local Law 44 data provides an opportunity to review and compare the actual per-unit costs and evaluate the factors that may influence this cost. Community development practitioners have believed that, for a variety of reasons, non-profit developers often have higher per-unit development costs. Local Law 44 gives the data to evaluate this question for the first time.
The data shows there is a difference in subsidy per-unit between for-profit and mission-driven non-profit developers, although less than community development practitioners anticipated. For-profits average $102,931 per unit for new construction and $19,576 per unit for preservation, while mission-driven developers average $103,192 per unit for new construction and $35,880 per unit for preservation. The discrepancy in per-unit cost is influenced by various factors, including depth of affordability, the project scale, and the complexity of tenant relations in preservation deals.
Recommendations
A FRAMEWORK FOR MAXIMIZING PUBLIC VALUE
Affordable housing development has always been challenging in New York City due to the various market challenges the City has faced in the past decades. Mayor de Blasio has taken steps to increase the public value, whether that is through creating deeper affordability term sheets, permanent affordability requirements, Mandatory Inclusionary Housing (MIH), or leveraging public and NYCHA land for affordable housing development. Understanding the true public value of affordable housing developed, however, cannot be quantified with the same metrics Mayor de Blasio uses towards his goal to create and preserve 300,000 units of affordable housing. A new framework is needed for the City and developers to maximize public value in affordable housing development as much as possible. To this end, ANHD recommends the following:
Methodology
The majority of the analysis in this report is based on data released under Local Law 44. The New York City Council passed Local Law 44 in 2012, requiring the New York City Department of Housing Preservation and Development (HPD) to collect and make public certain information about housing development projects receiving city financial assistance. The Local Law 44 dataset used for this analysis is comprehensive of the first four fiscal years of Mayor de Blasio’s term (Fiscal Years 2015, 2016, 2017 and 2018), and it includes 49,746 units of permanent rental affordable housing from 283 closings created during this four-year period.